Power BI
Create a basic dashboard in Power BI using Vizion data
This guide provides an introductory walkthrough for connecting Vizion’s Container Tracking API to Power BI. It uses Vizion’s No Code Workbook as the data source to power the dashboard. If you aren't familiar, the No Code Workbook is a solution Vizion provides customers that allows for immediate tracking of containers without needing to write any code.
It’s important to note the difference between using Power BI Service and the Power BI Desktop App. The service is a cloud-based platform accessible via web browser, while the Desktop App provides advanced capabilities for data analysis. This guide references the Power BI service so some of these steps may be slightly different within the desktop application.
Add a data source
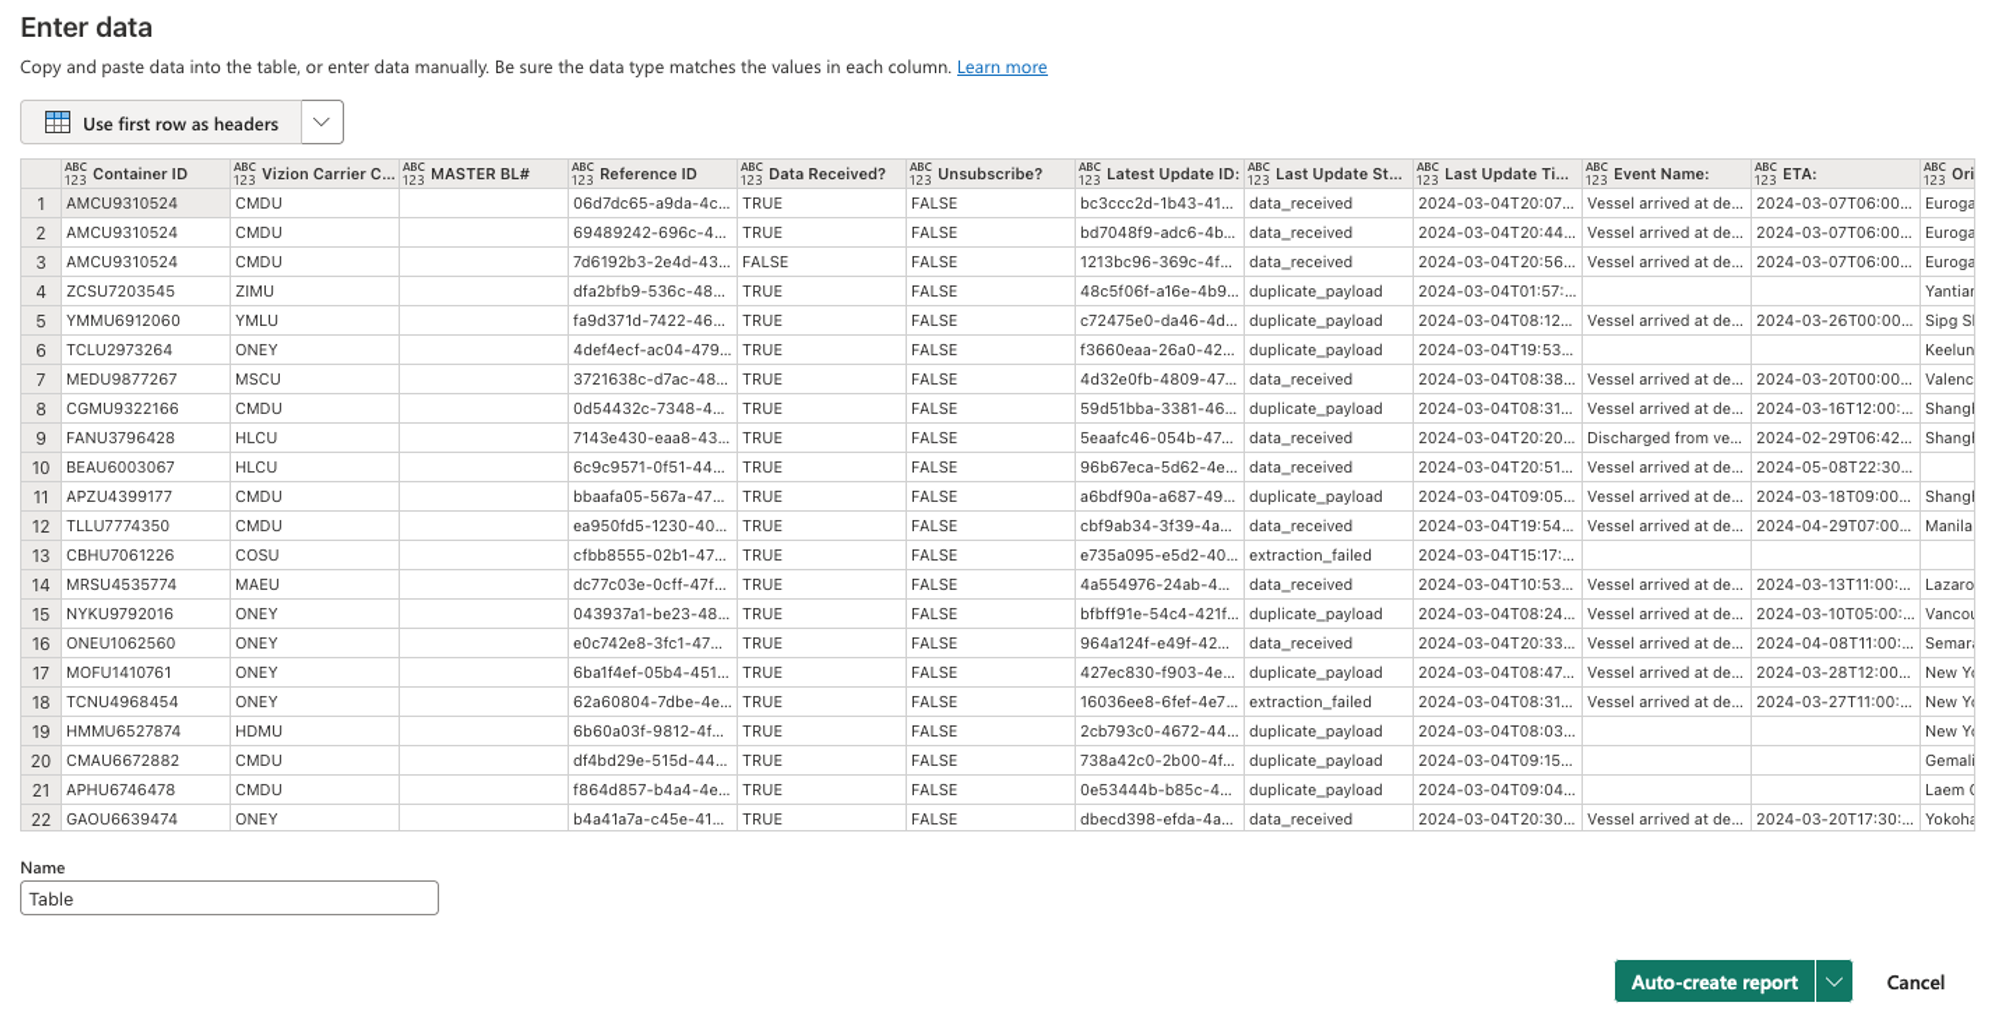
Start by adding a new report and data source. With the desktop app, you can choose to connect to an Excel sheet. The No Code Workbook is a Google sheet by default but you can easily use data from the No Code Workbook in an Excel spreadsheet. The Power BI service is limited to manual import. This can be achieved by copying the 'Containers' tab from the No Code Workbook and specifying the first row as the column headers.
Create basic text fields
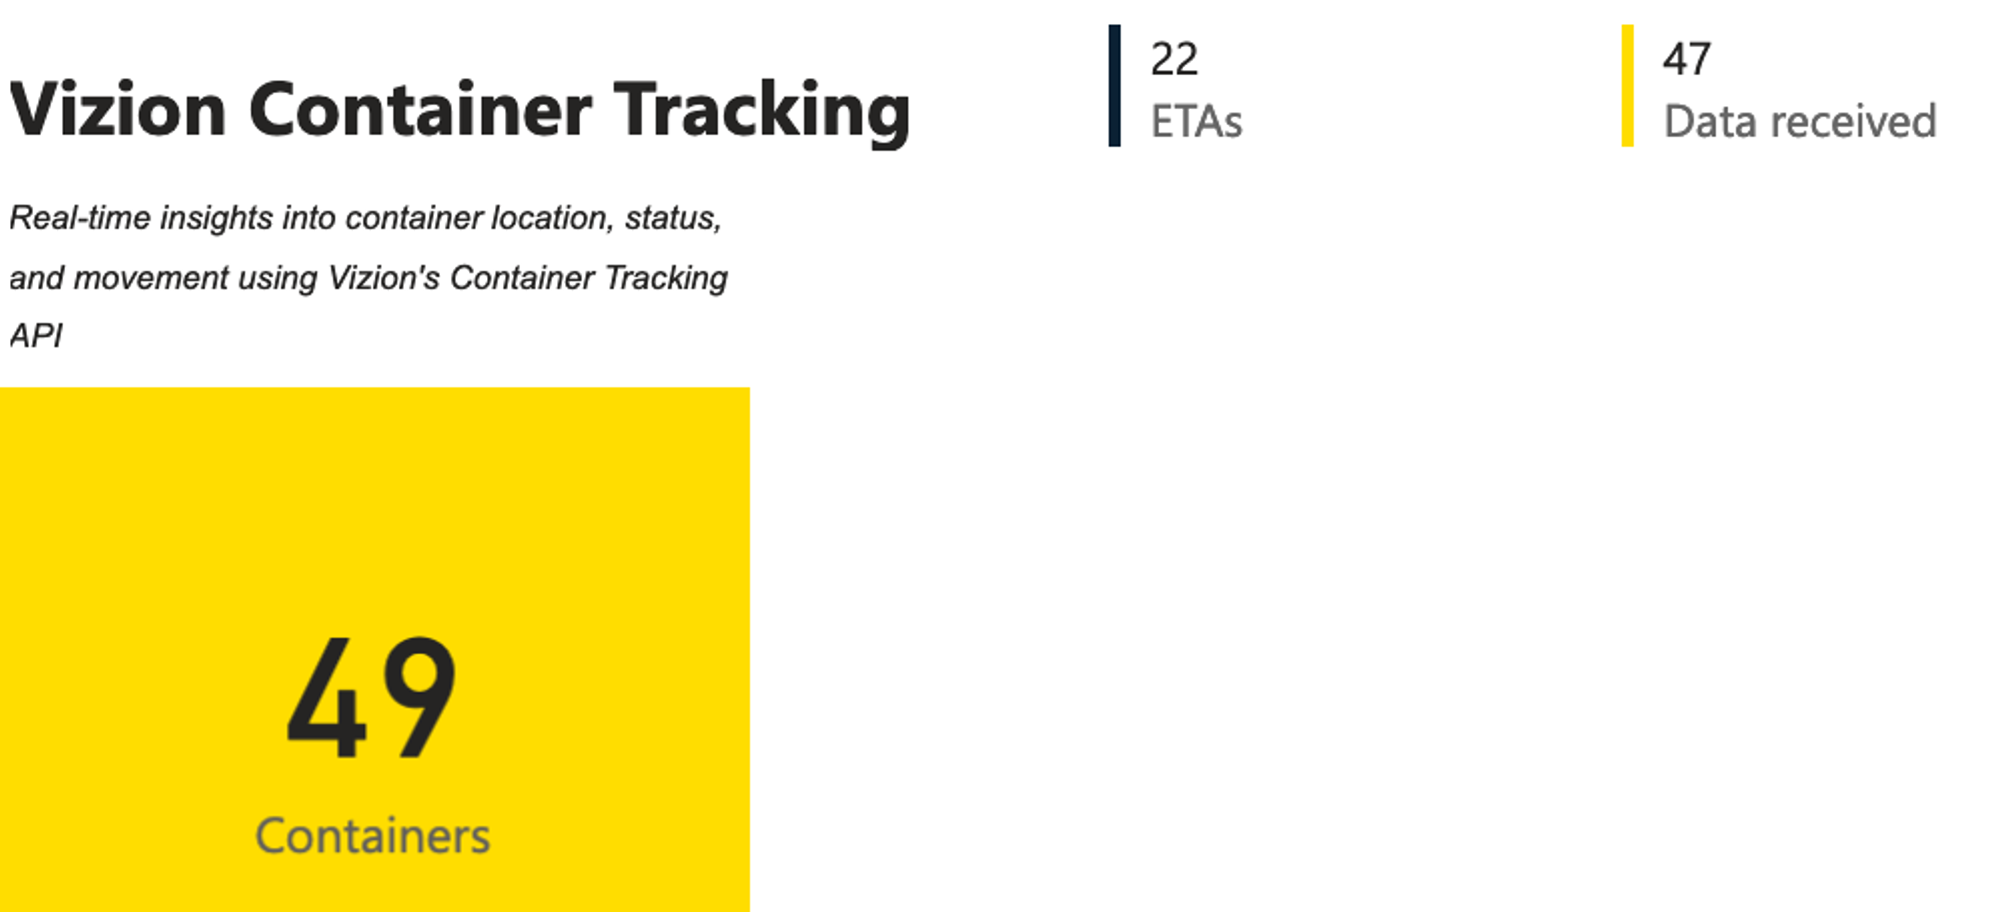
Once the data is imported, you can create basic text fields in Power BI using the Card visualization. Choose key data points such as Estimated Time of Arrival (ETA) and Data Received to analyze container tracking metrics.
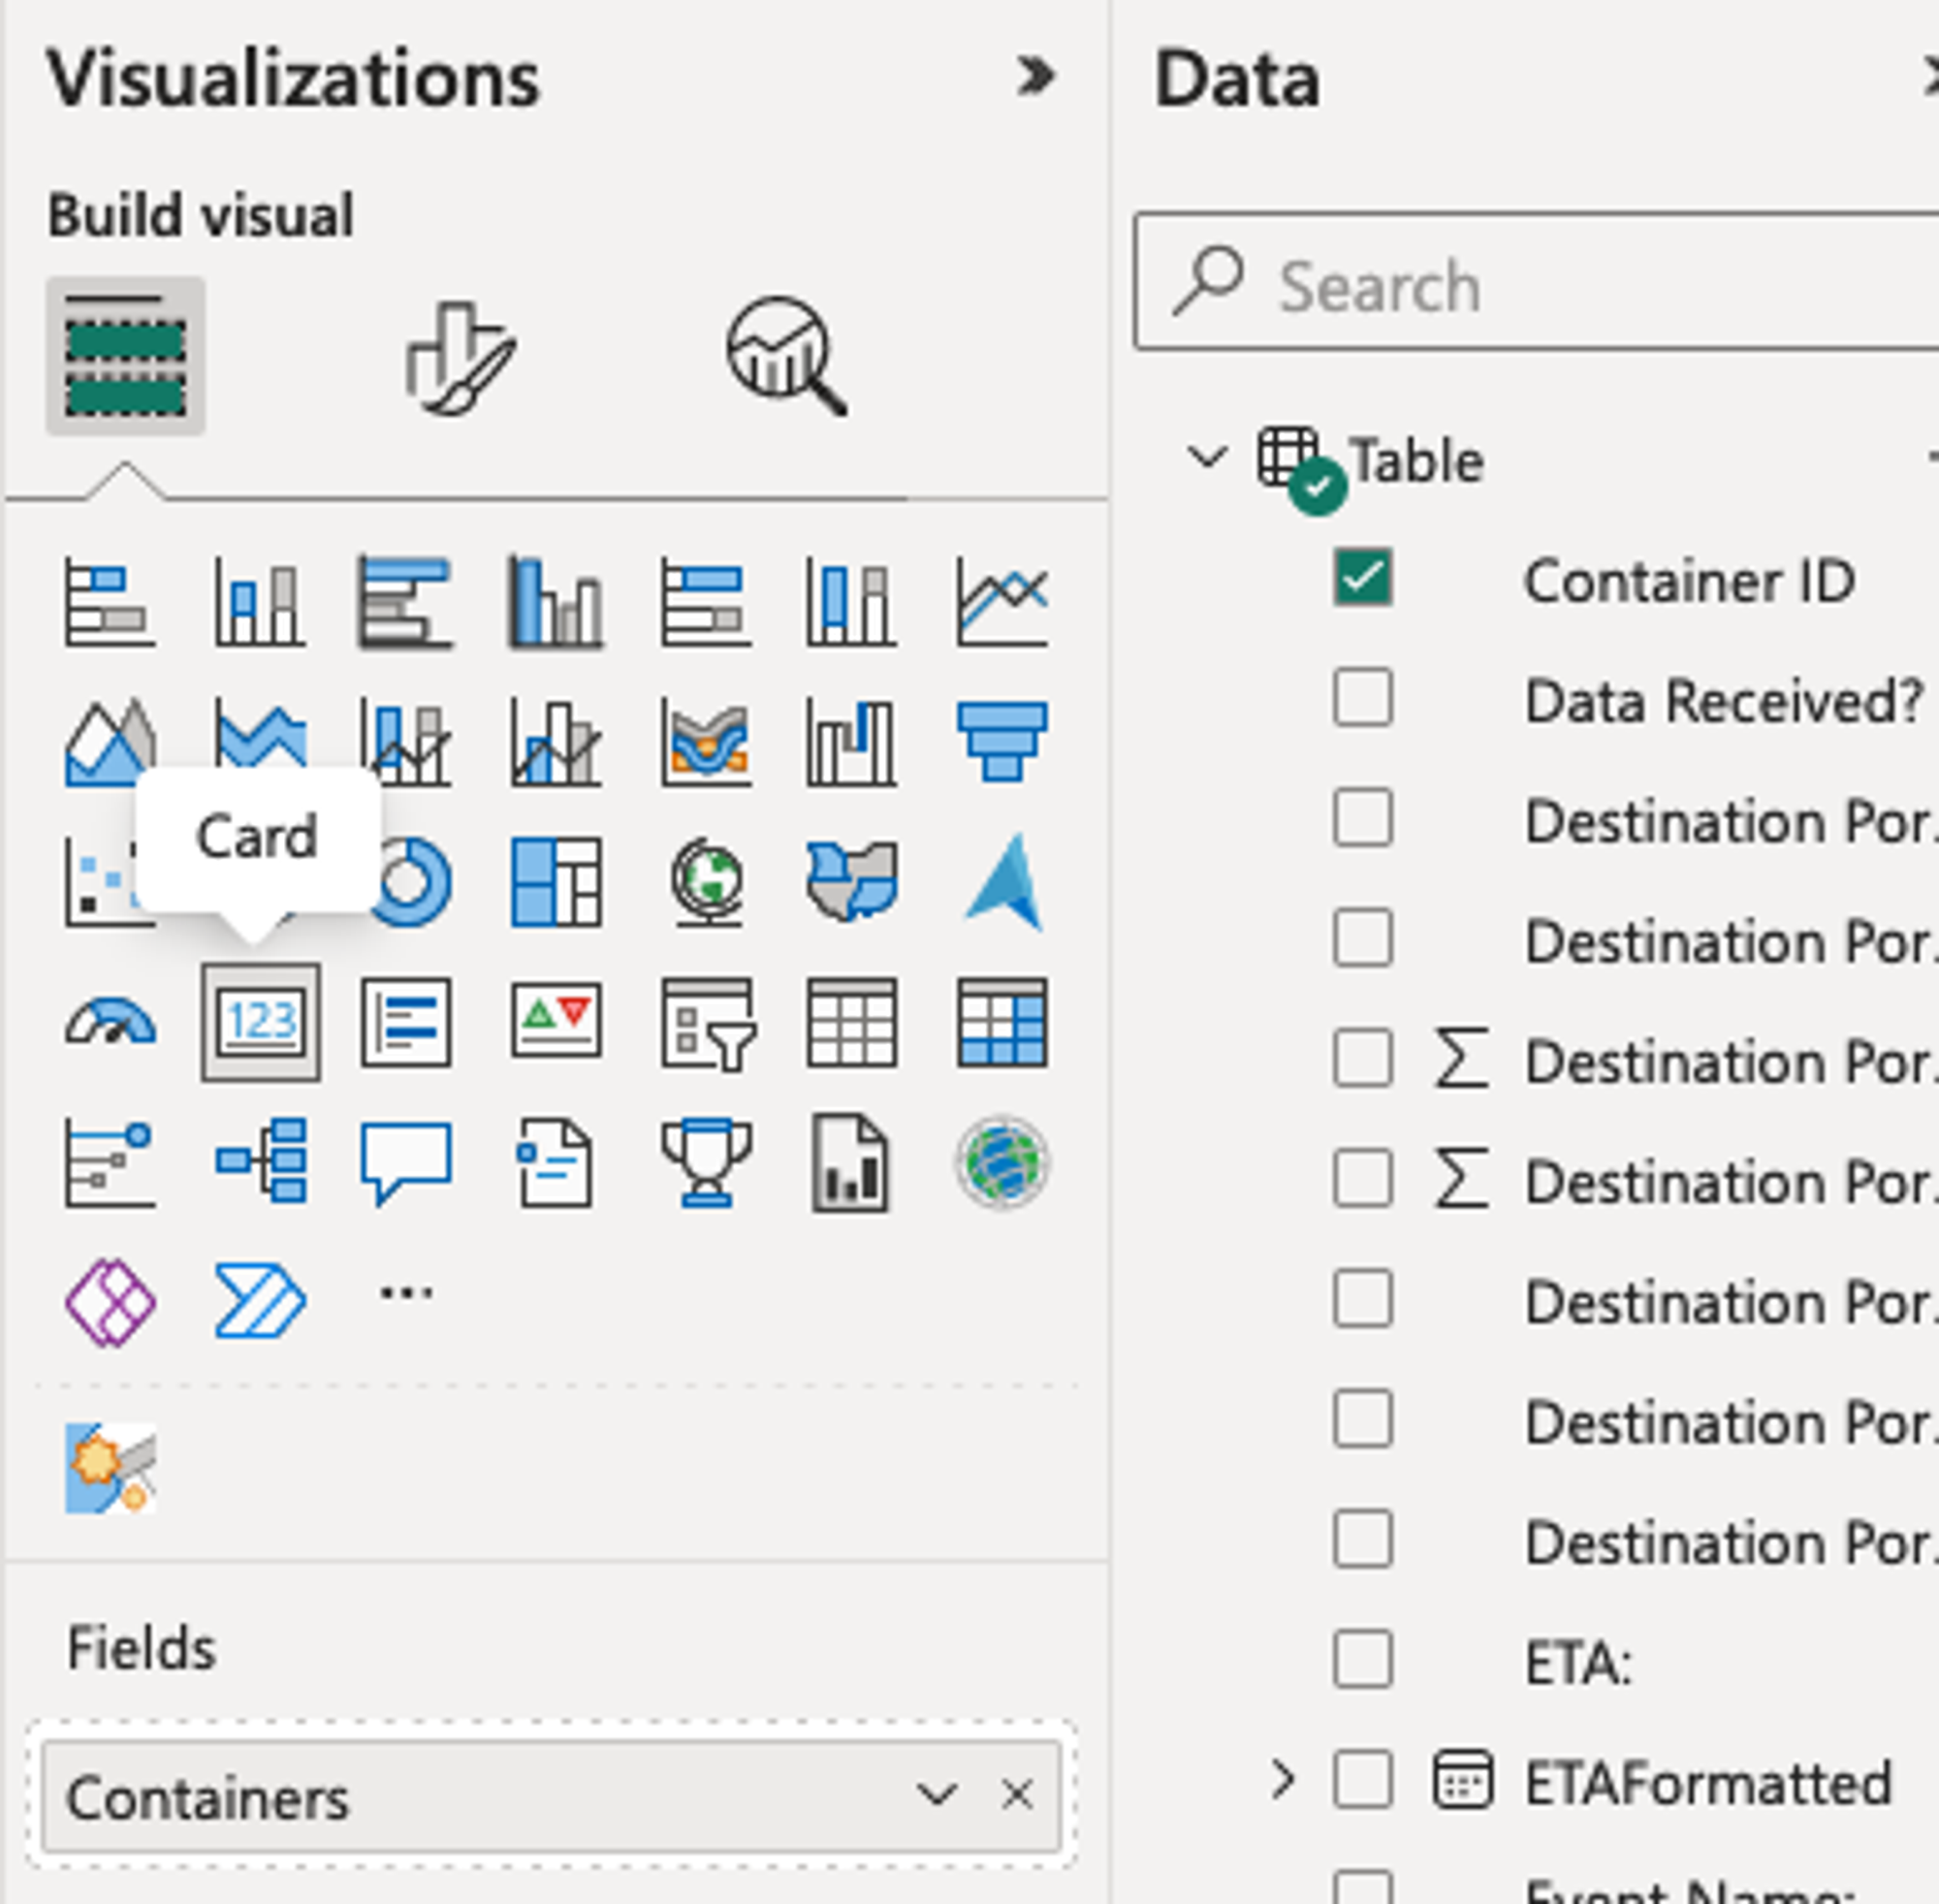
You can further customize these fields using data from the No Code Workbook to meet your reporting needs. The below example utilizes the Container ID, ETA, and Data Received fields.
Pie chart breakdown by Carrier Code
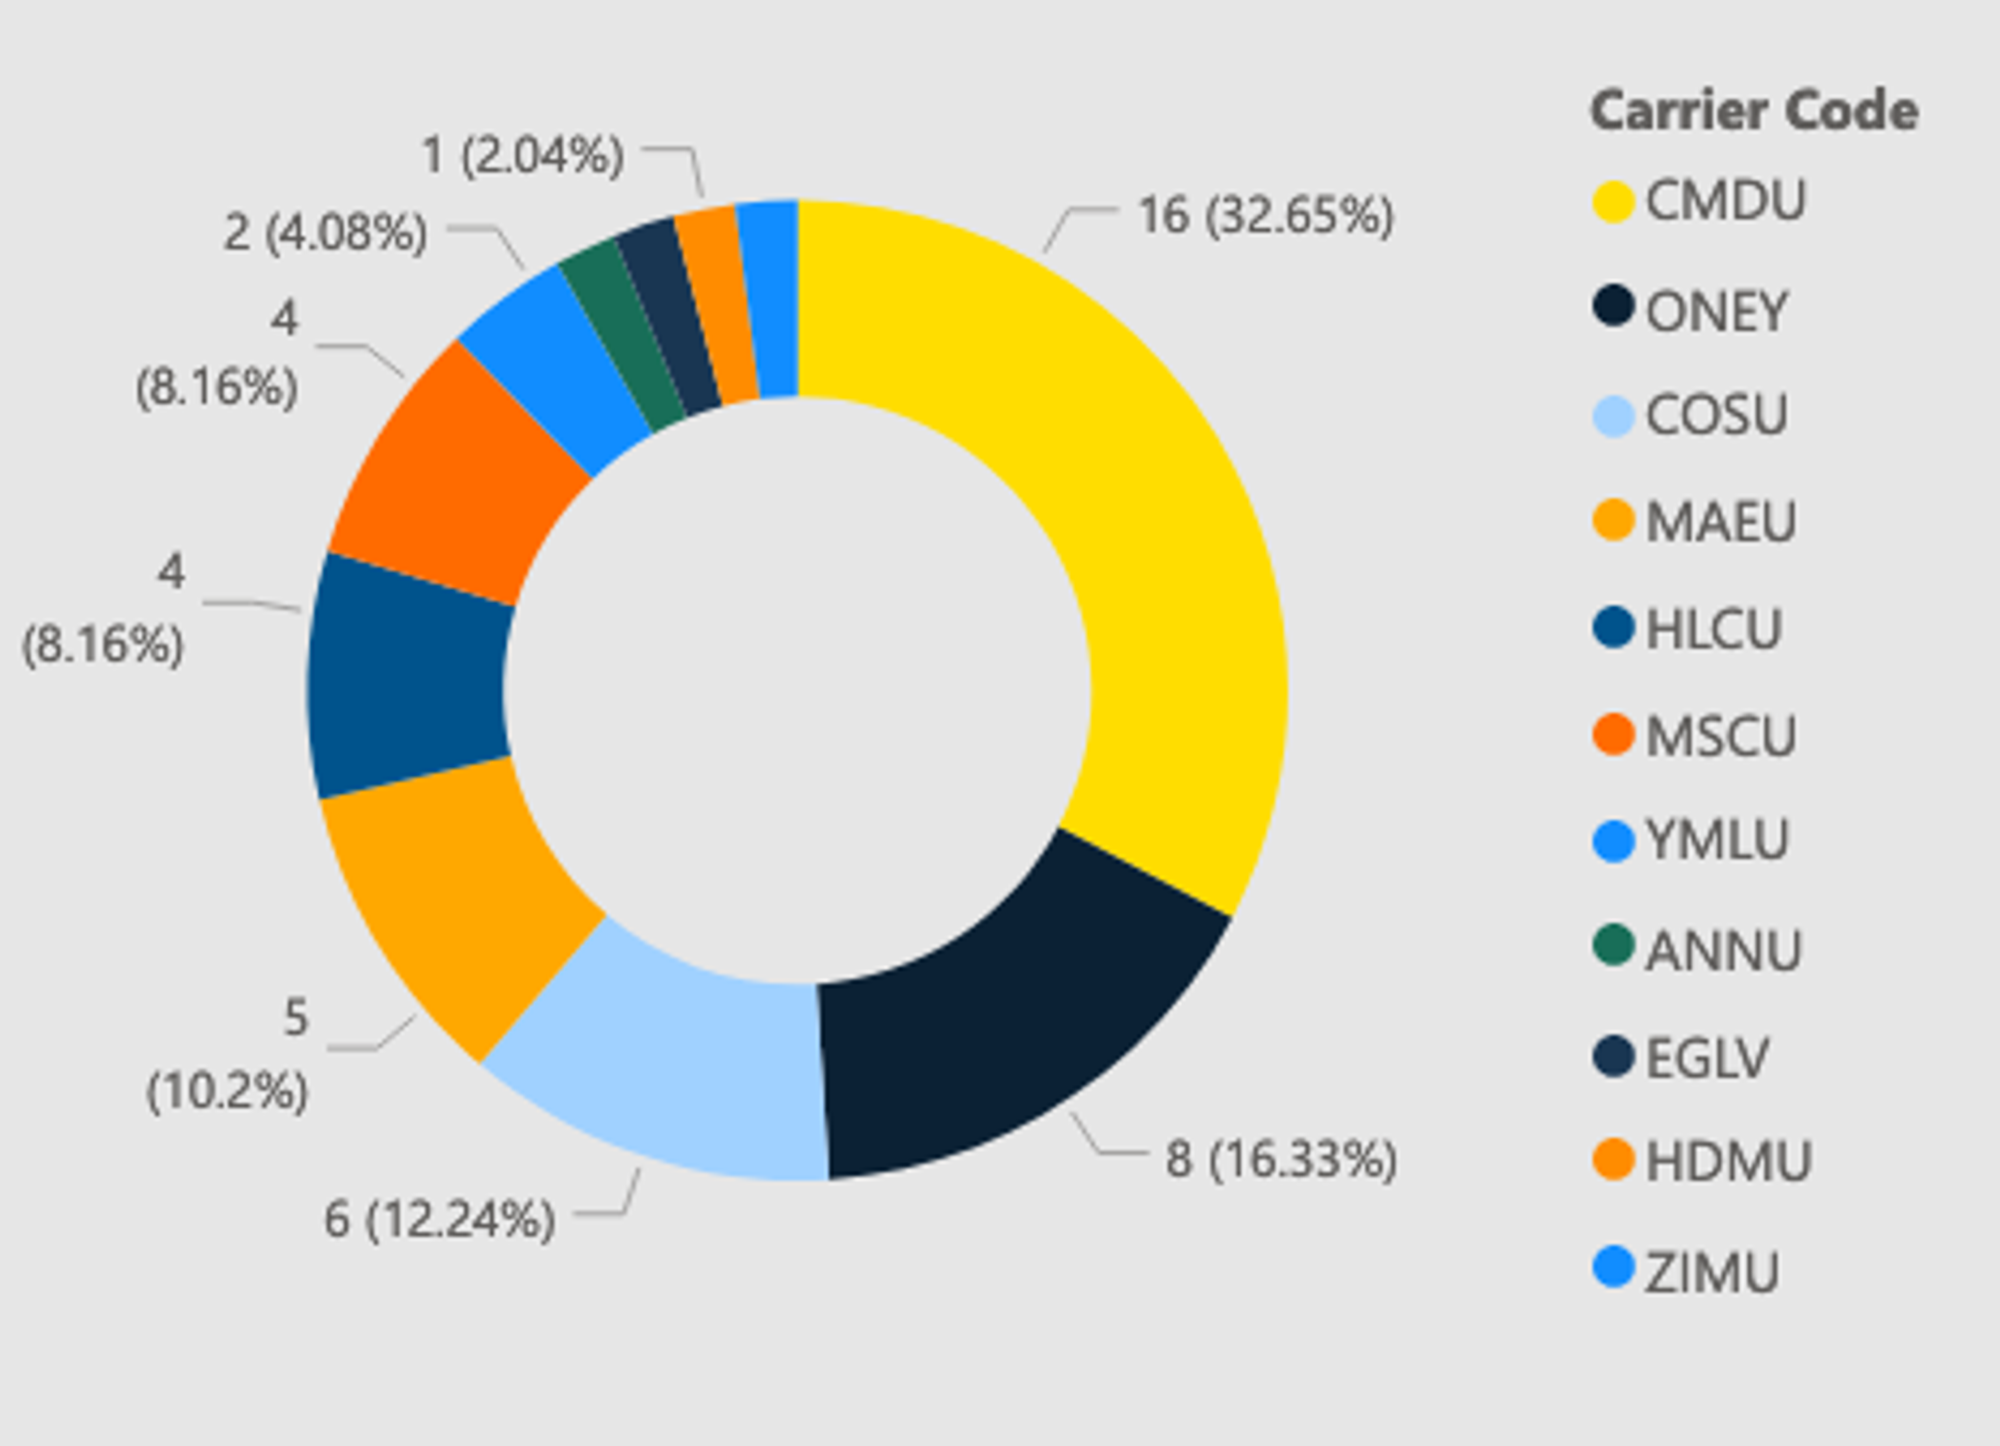
See container distribution by carrier code using a pie chart. Select Carrier Code as the legend and Container ID as the value to represent different carriers. Filter options allow for detailed analysis by carrier.
Origin and destination ports bar charts
Explore container origins and destination ports through bar chart visuals. Use Destination Port Country and Origin Port Country on the y-axis and Container ID on the x-axis to visualize port distribution by country.
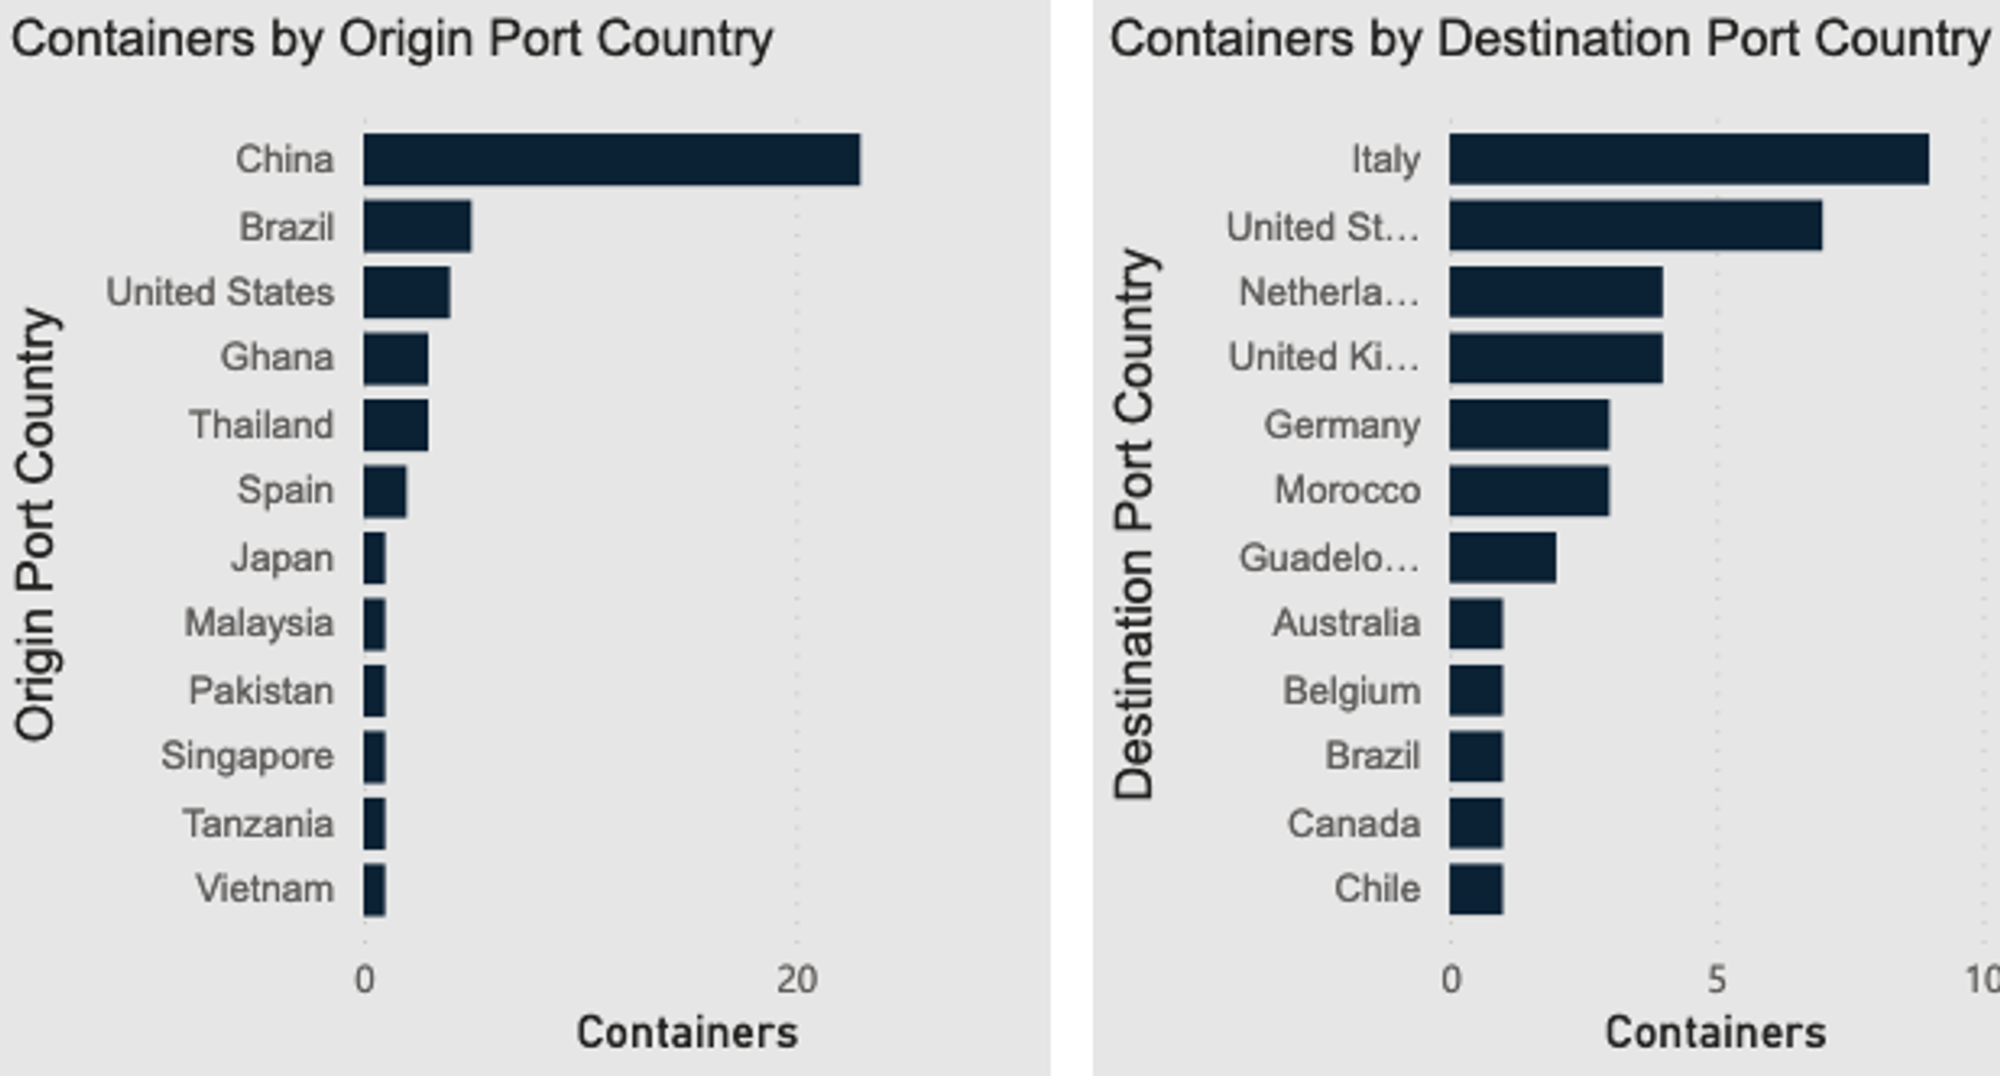
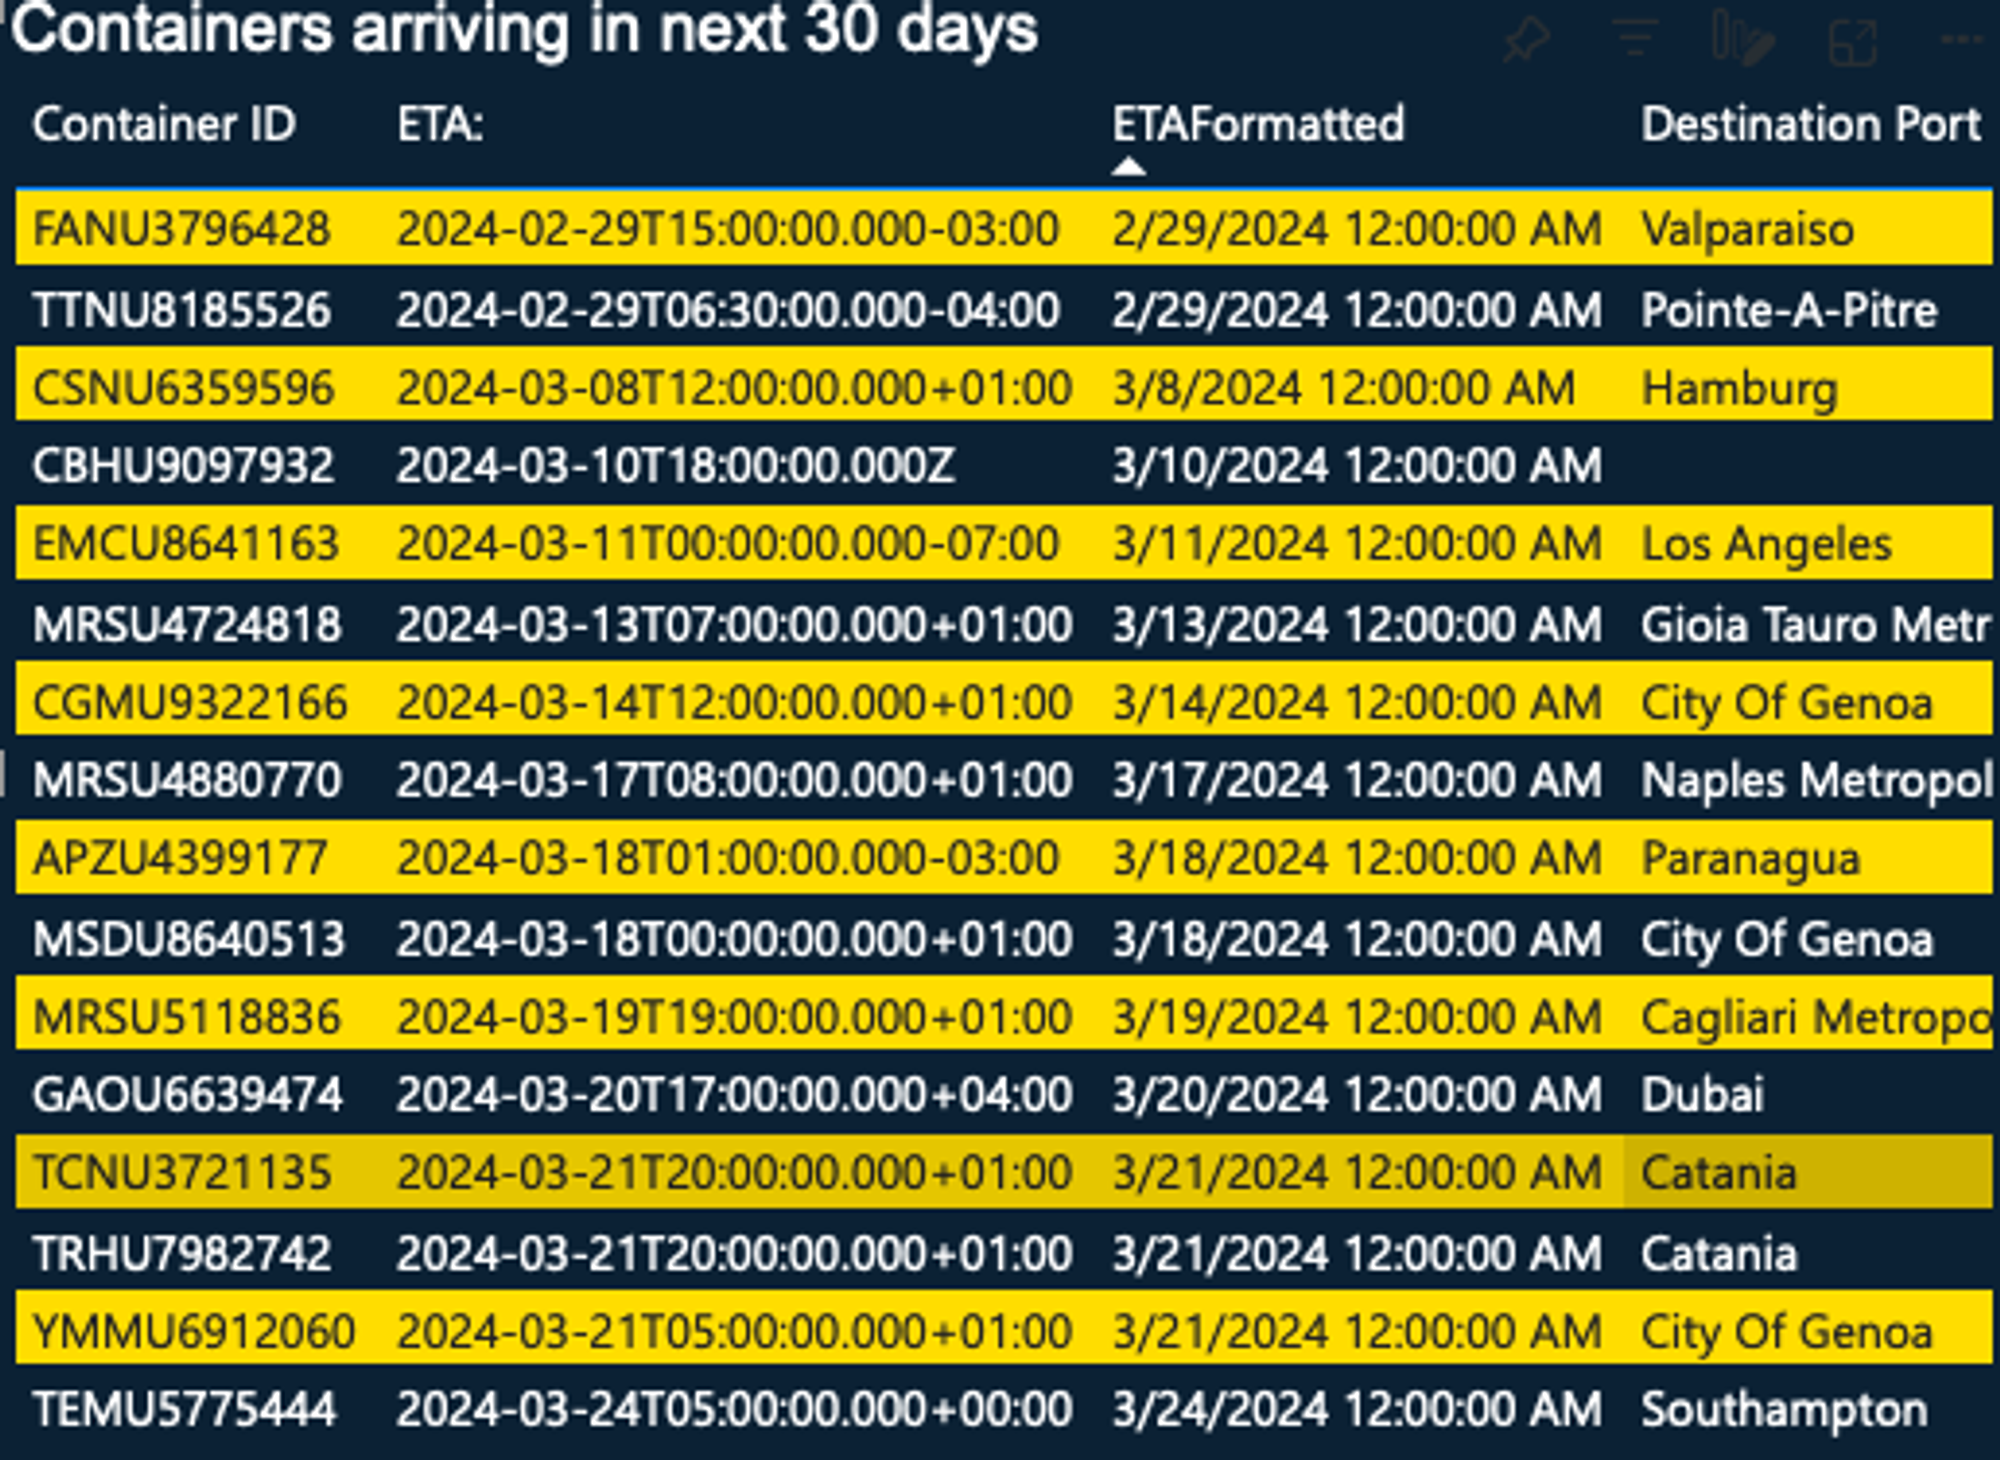
Table for containers arriving in the next 30 days
To create a table displaying containers arriving in the next 30 days, first convert the timestamp into a format that will allow date filtering. Then use the new ETA Formatted column as a filter to display relevant containers.
- Open the data model.
- Add a new column.
- Within the formula box, input the formula below that converts the ETA string into the correct timestamp format.
  ETAFormatted =
VAR DateString = LEFT('Table'[ETA:], 10) // Extract date portion (YYYY-MM-DD)
RETURN
IFERROR(DATEVALUE(DateString), BLANK()) // Convert to date data type
Now that you have successfully formatted the ETA, navigate to the filter option and choose 'Basic Filtering.' From there, select 'Relative Date' and choose next 30 days. You will now have a clear view of containers arriving in the next 30 days.
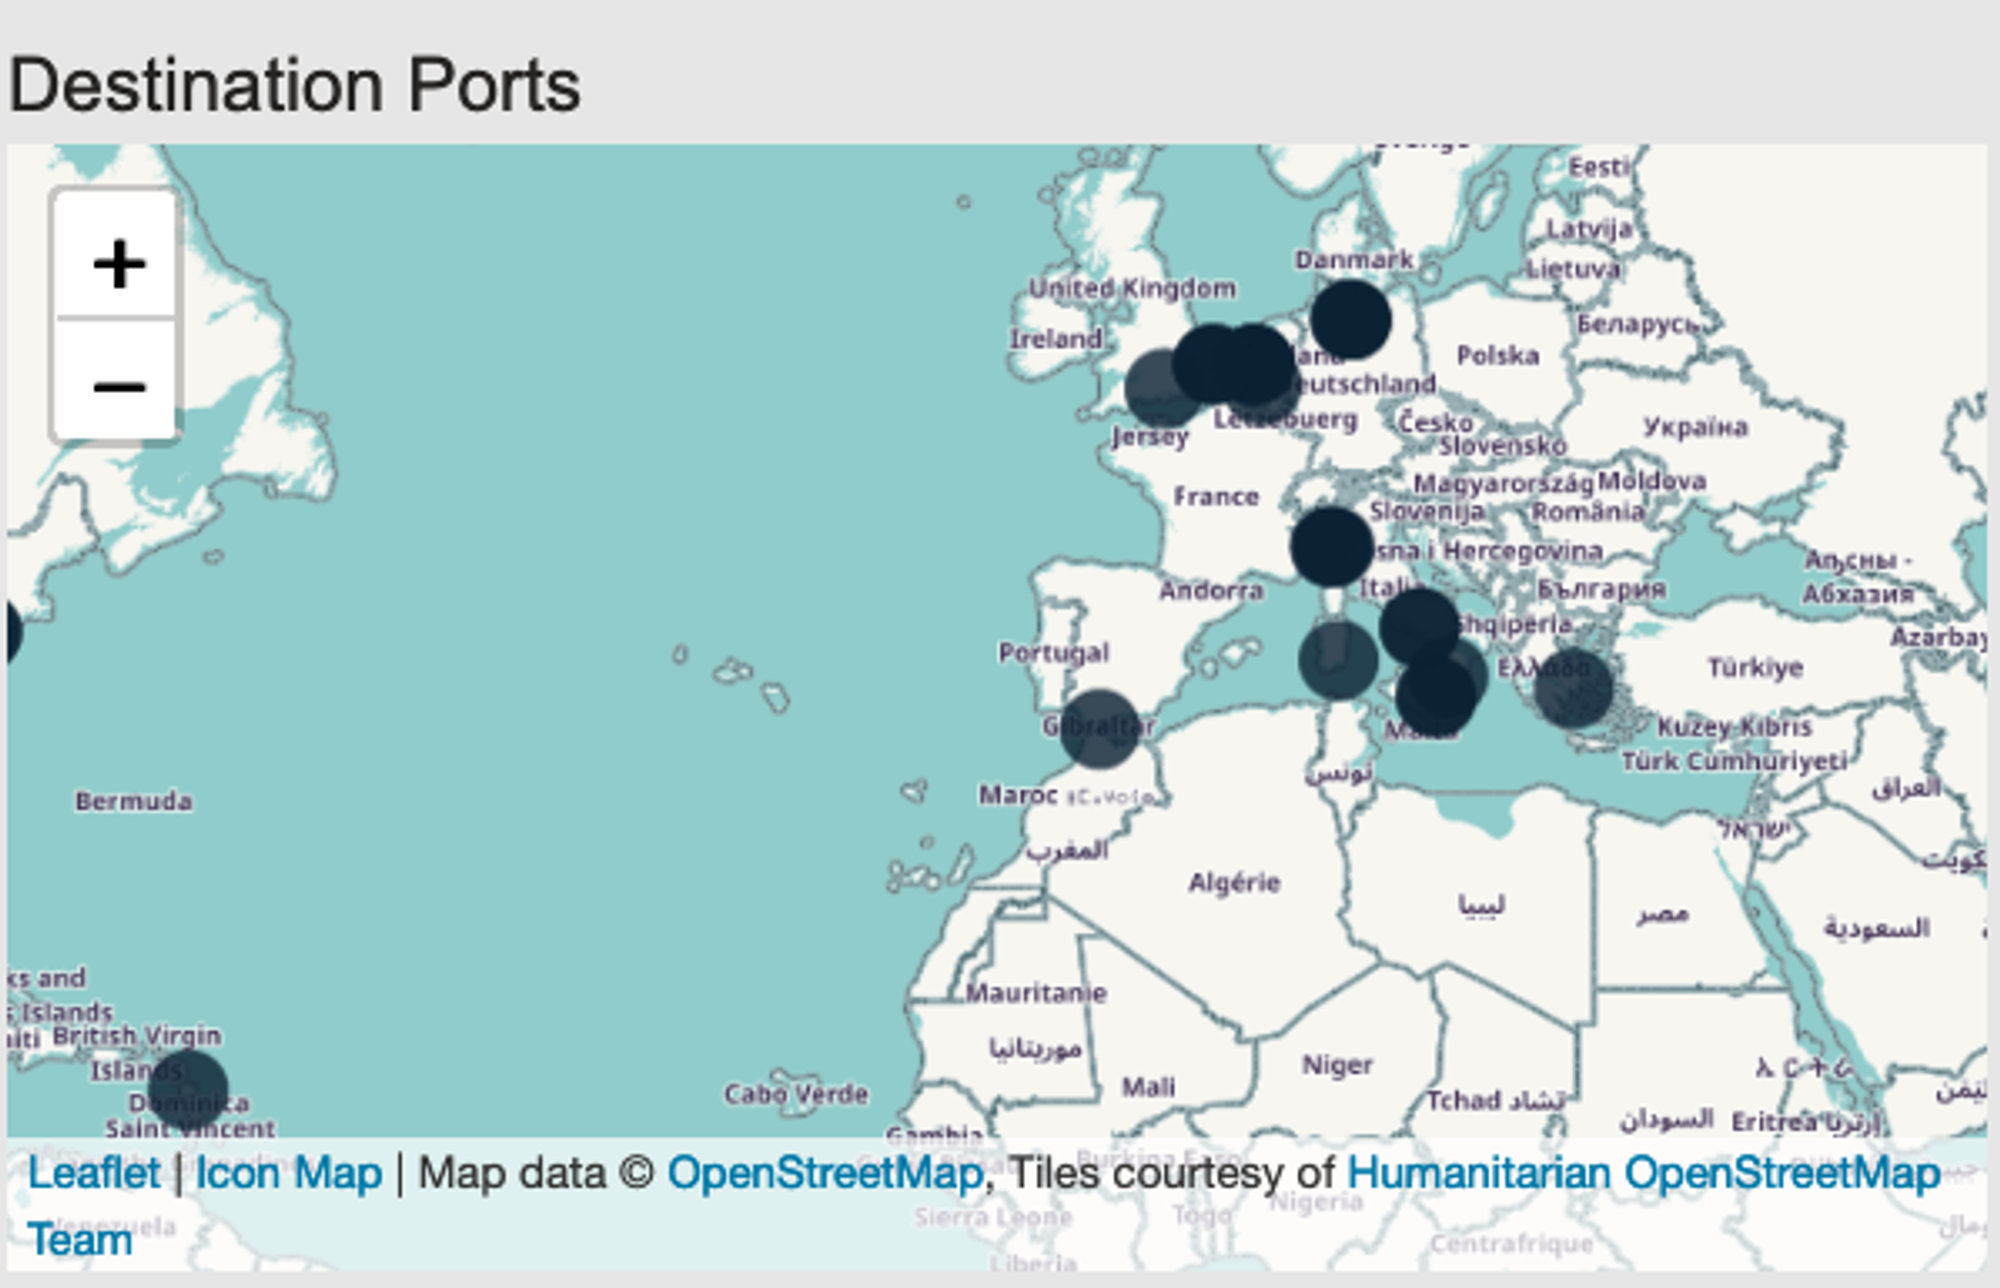
Destination port map
To wrap up, add a final visualization to the dashboard to show destination ports geographically. To do this, select 'Get More Visuals' section and search for the icon map visual. Once you've downloaded the visual, it's a straightforward process to select the appropriate fields for latitude and longitude to suit your use case. Now, when you hover over the map, you'll see the locations of the destination ports along with their corresponding container IDs and counts.
After styling and customization, your Power BI dashboard is ready for use. This final product represents a comprehensive container tracking dashboard, allowing for efficient monitoring and analysis.

Updated 10 months ago