
BoxTrack App 2.0
BoxTrack 2.0 is Vizion's next-generation container tracking and supply chain intelligence platform. It combines real-time shipment visibility with performance analytics, sailing search, and curated risk intelligence to help you plan, track, and manage your ocean freight from a single workspace.
BoxTrack 2.0 is organized into five main sections, accessible from the top navigation bar:
| Section | What it does |
|---|---|
| Dashboard | Real-time freight and supply chain performance insights, organized as customizable widgets. |
| Plan | Search sailing schedules between ports and compare services across carriers. |
| Track | Your shipment tracking workspace with Smart Boards, filters, and multiple view modes. |
| Risk | Curated intelligence briefs on disruptions, delays, and market events affecting global supply chains. |
| Tasks | (Coming soon) Task management for shipment-related action items. |
Creating an account and logging in
Before you can start tracking shipments, you'll need to create a BoxTrack account.
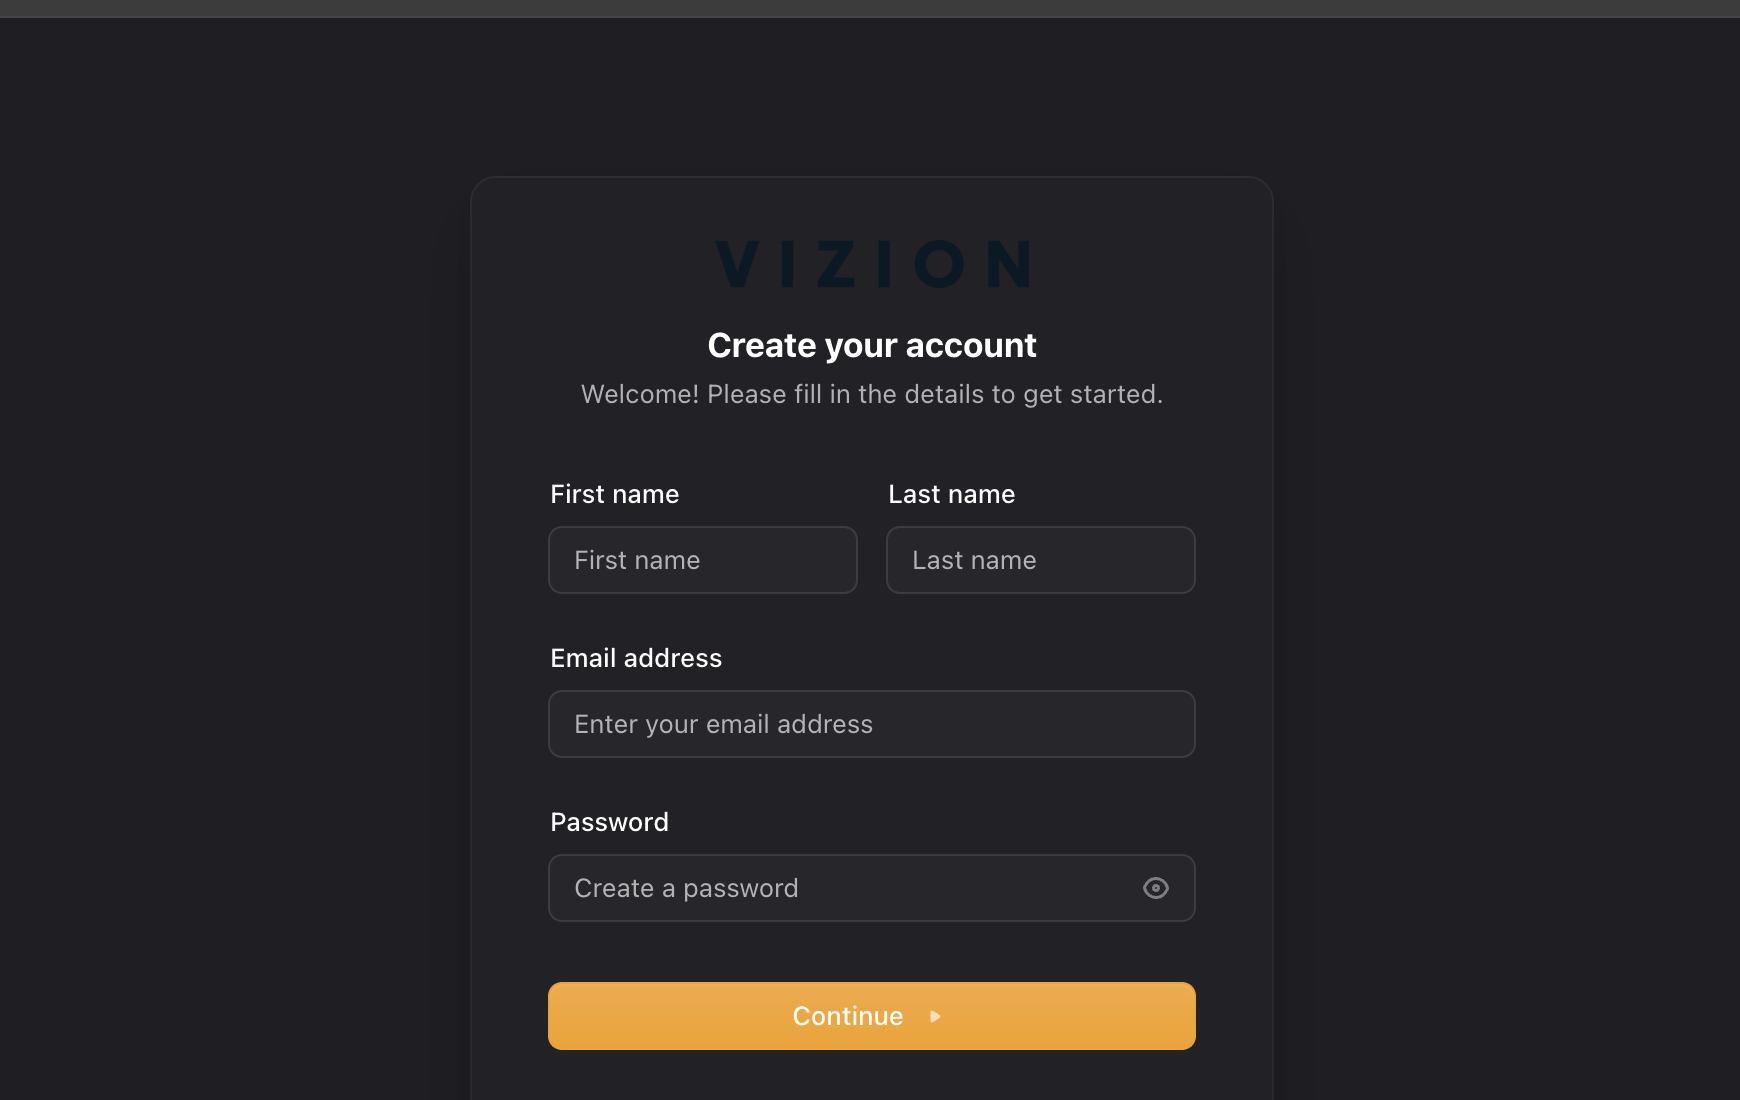
- Go to the BoxTrack sign-up page: https://accounts.app.vizionapi.com/sign-up.
- Click Sign Up if you don't already have an account.
- Fill in the required information:
- Name
- Work email (must be a business email address)
- Password (must have 1 uppercase letter, 1 special character, and a minimum of 8 characters total)
- Click Continue.
- You will be directed to the Dashboard.
You can also sign in using a passkey if your browser supports it.
Demo usage of BoxTrackYou can test BoxTrack before subscribing. While in demo mode, BoxTrack is limited to a lifetime total of 10 tracked containers, with no credit card required.
Dashboard
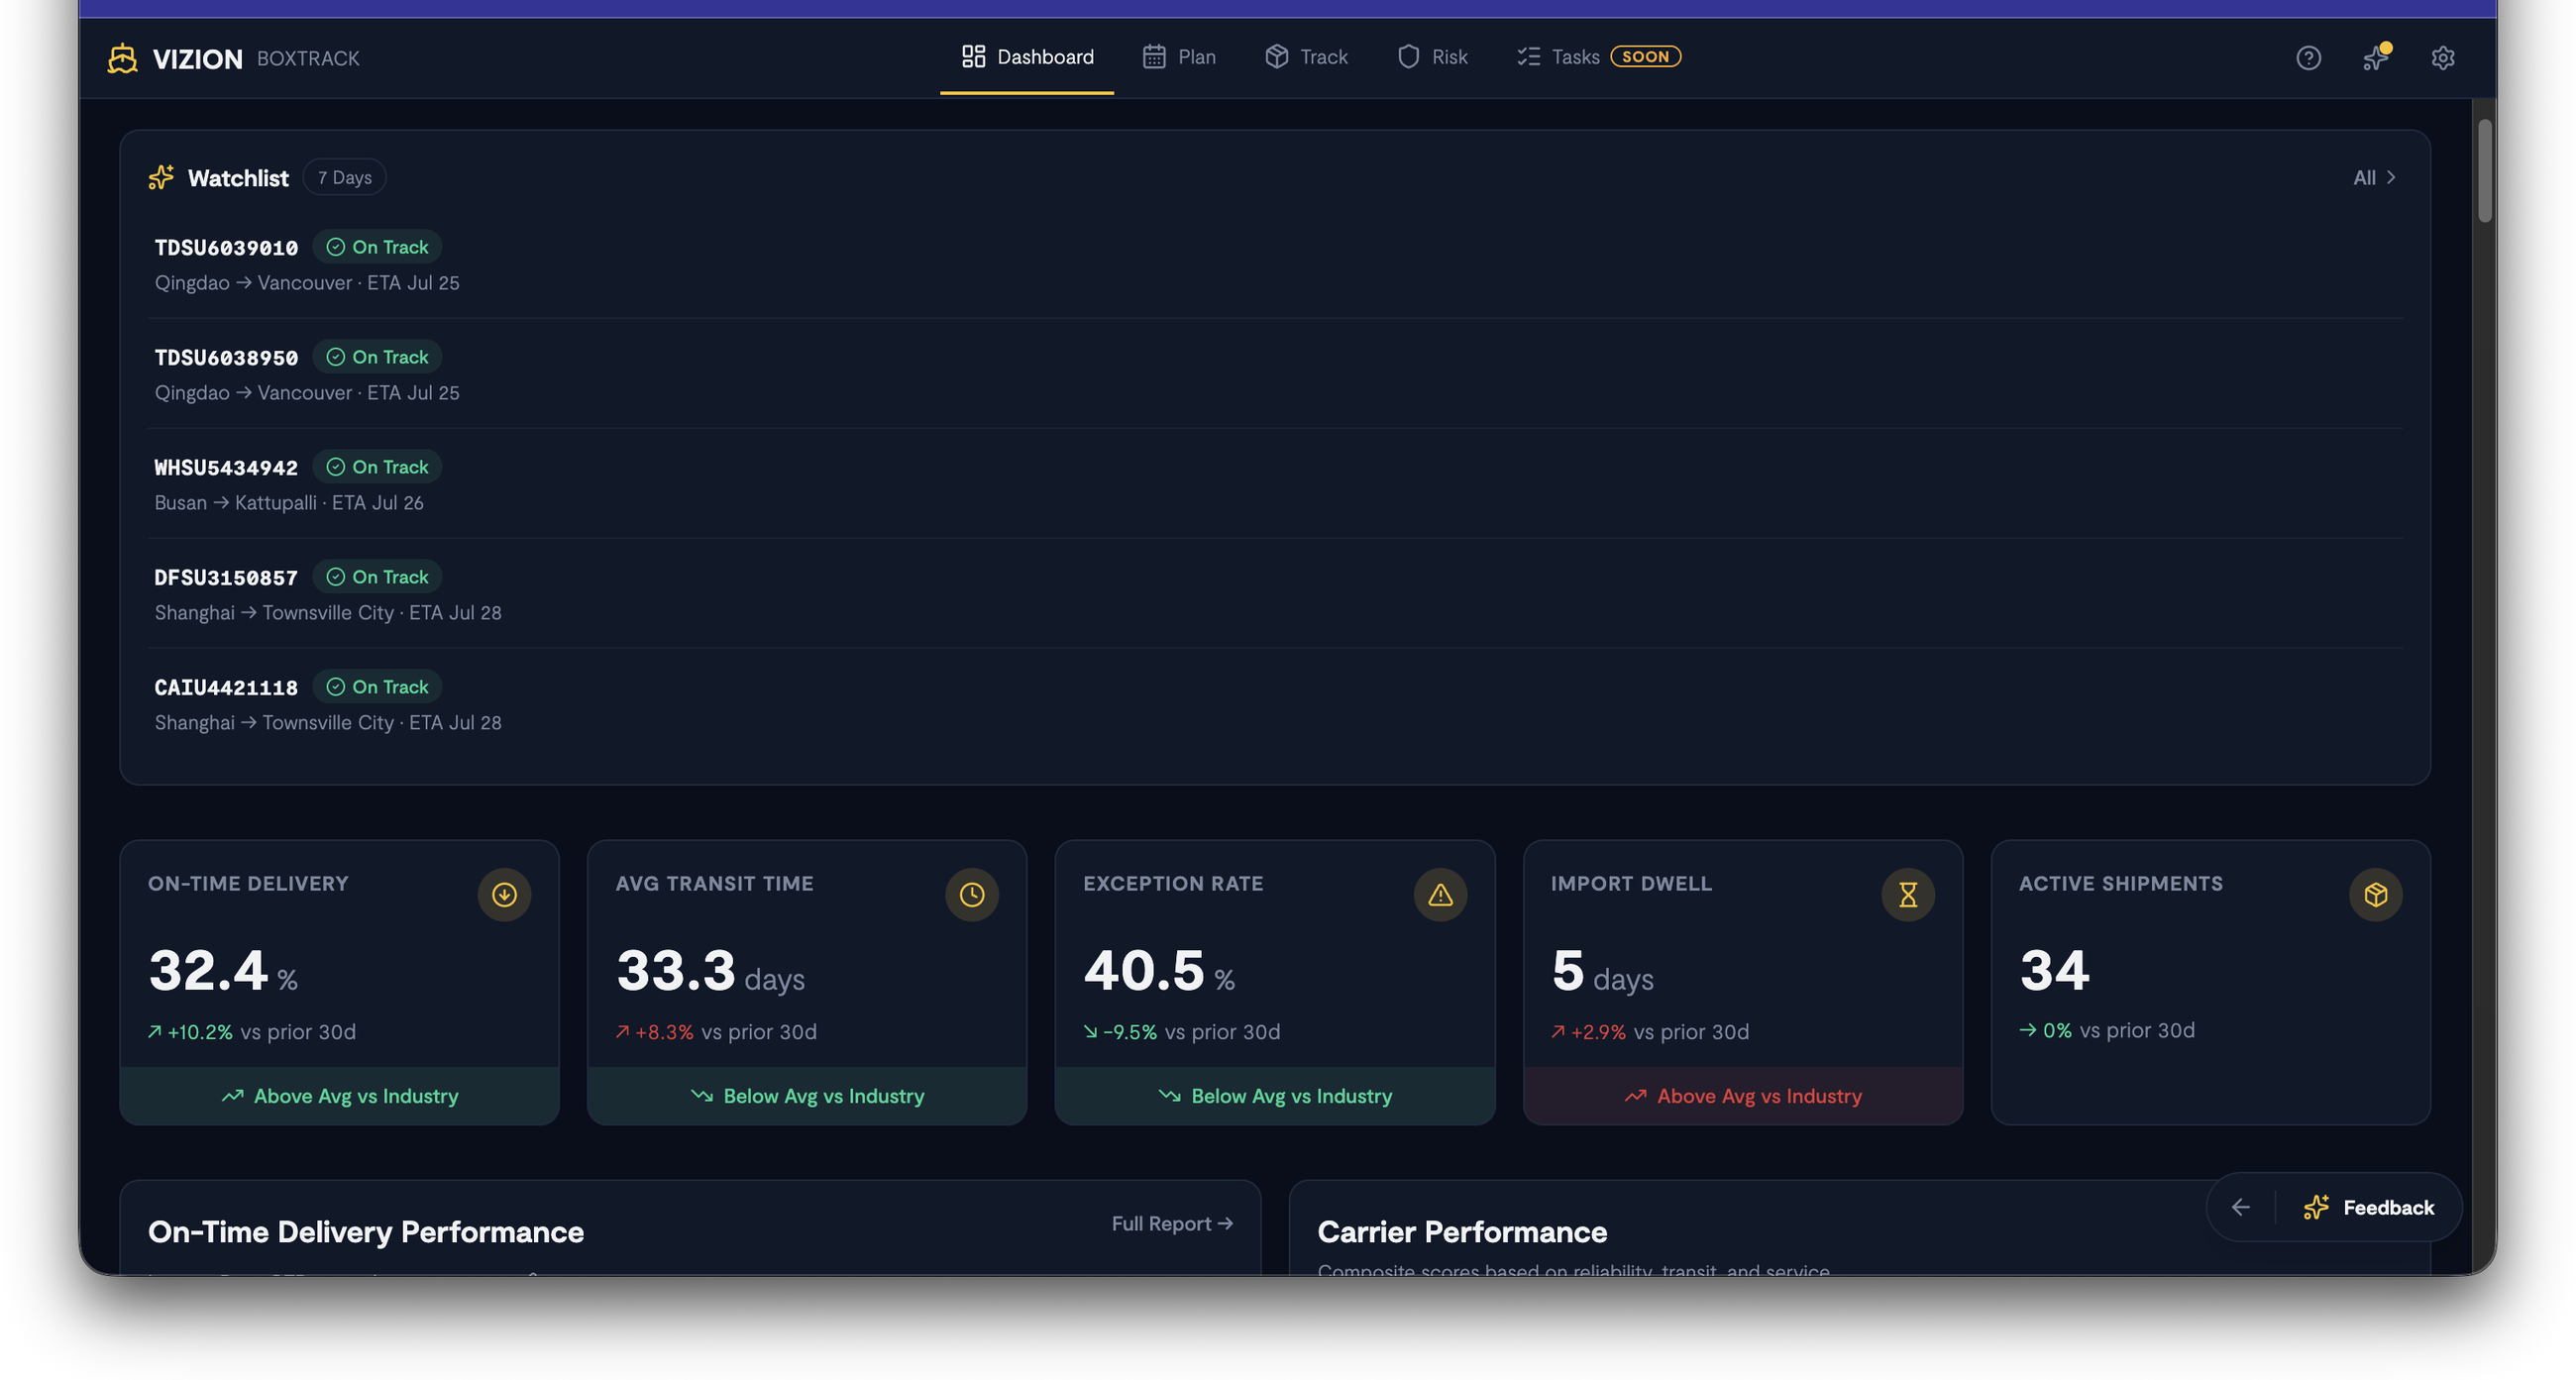
The Dashboard provides a real-time overview of your freight and supply chain performance, organized as draggable, customizable widgets.
Time window
Use the date range selector in the top-right corner to set the time window for all dashboard widgets. Options include preset ranges (e.g., Last 30 Days) or custom date ranges. Every widget on the dashboard updates to match the selected window.
Watchlist
The Watchlist widget displays your watched shipments with their current status and ETA. Filter between shipments arriving within 7 Days or view All watched shipments. Each entry shows:
- Container ID
- Status indicator (e.g., On Track)
- Origin and destination ports
- ETA
Click any shipment in the Watchlist to navigate directly to its detail page.
Performance KPI cards
A row of key performance indicator cards provides at-a-glance metrics, each compared against the prior period and industry averages:
| KPI | What it measures |
|---|---|
| On-Time Delivery | Percentage of shipments arriving within the expected window, with trend vs. prior period and industry comparison. |
| Avg Transit Time | Average transit duration in days across your shipments. |
| Exception Rate | Percentage of shipments that encountered exceptions (delays, holds, rollovers). |
| Import Dwell | Average days containers spend at the destination port before pickup. |
| Active Shipments | Total number of currently active shipments being tracked. |

On-Time Delivery Performance
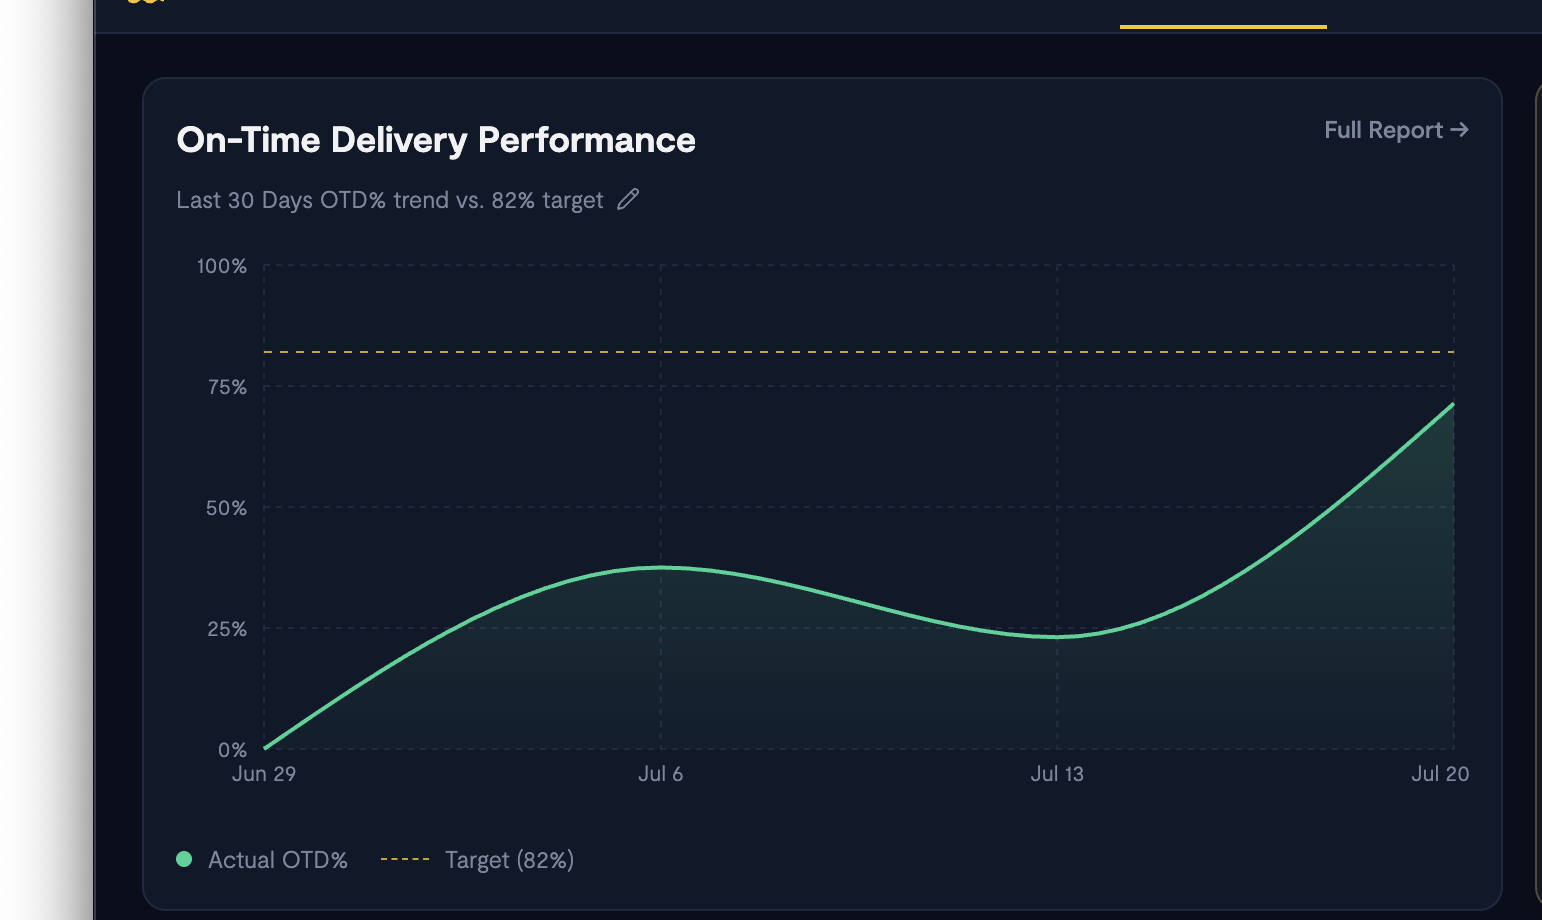
A time-series chart showing your OTD percentage trend over the selected period against a configurable target (default 82%). Click Edit OTD target to adjust the target line. Click Full Report to open the detailed carrier OTD comparison view.
Carrier Performance
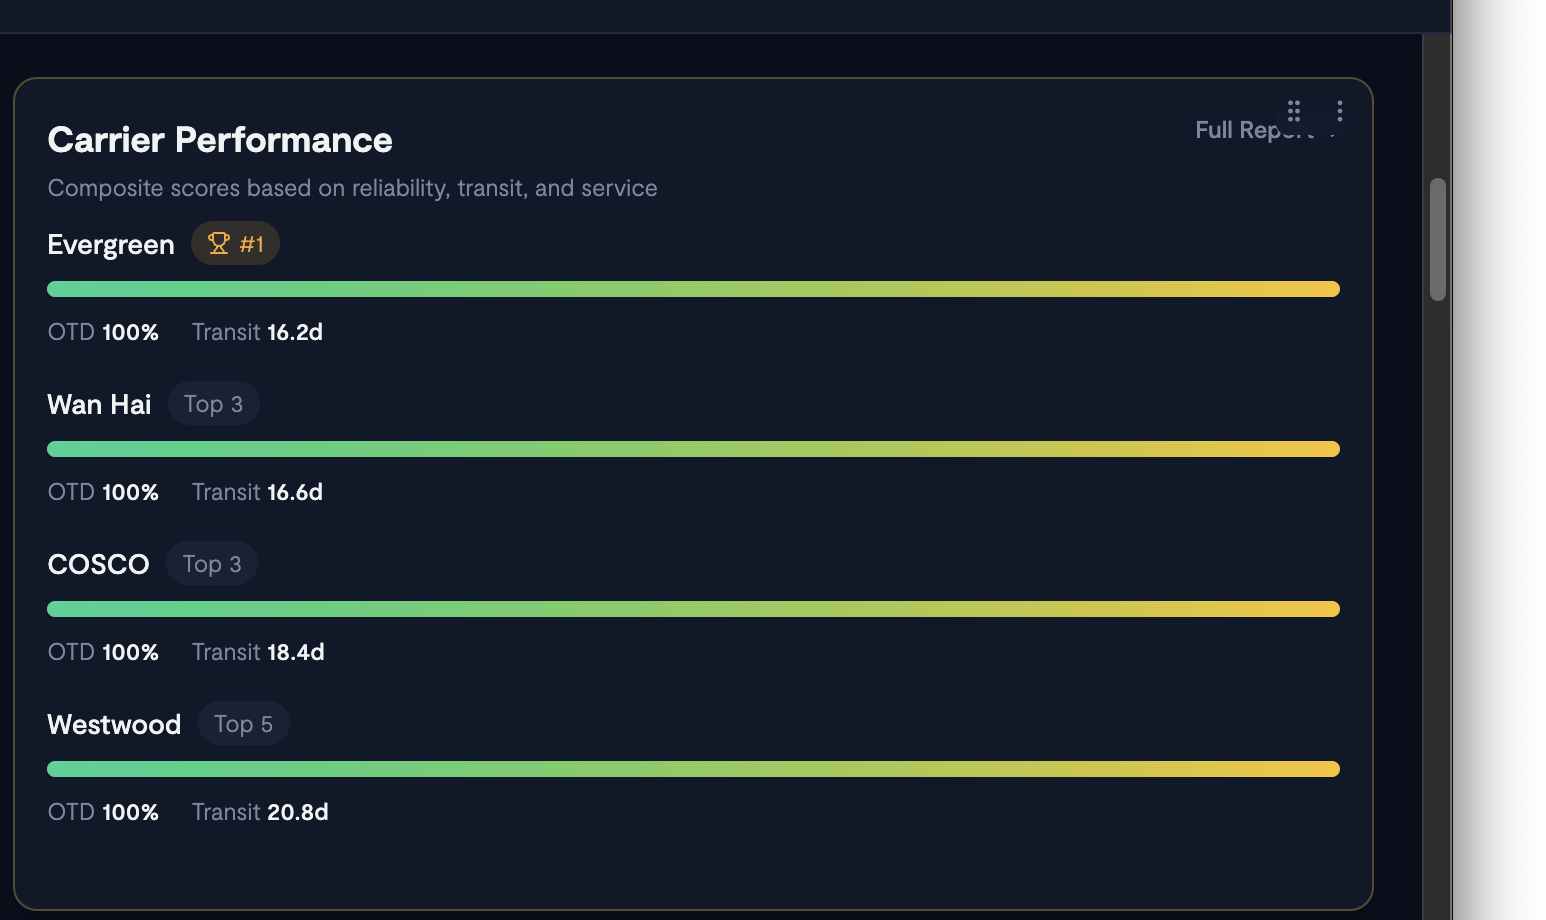
Displays your top-performing carriers ranked by a composite score based on reliability, transit time, and service quality. Each carrier entry shows OTD percentage and average transit time.
Industry Benchmark
Compares your performance against industry averages across four dimensions: On-Time Delivery, Exception Rate, Transit Time, and Port Dwell. Each metric is color-coded to show whether you are above, within, or below industry average.
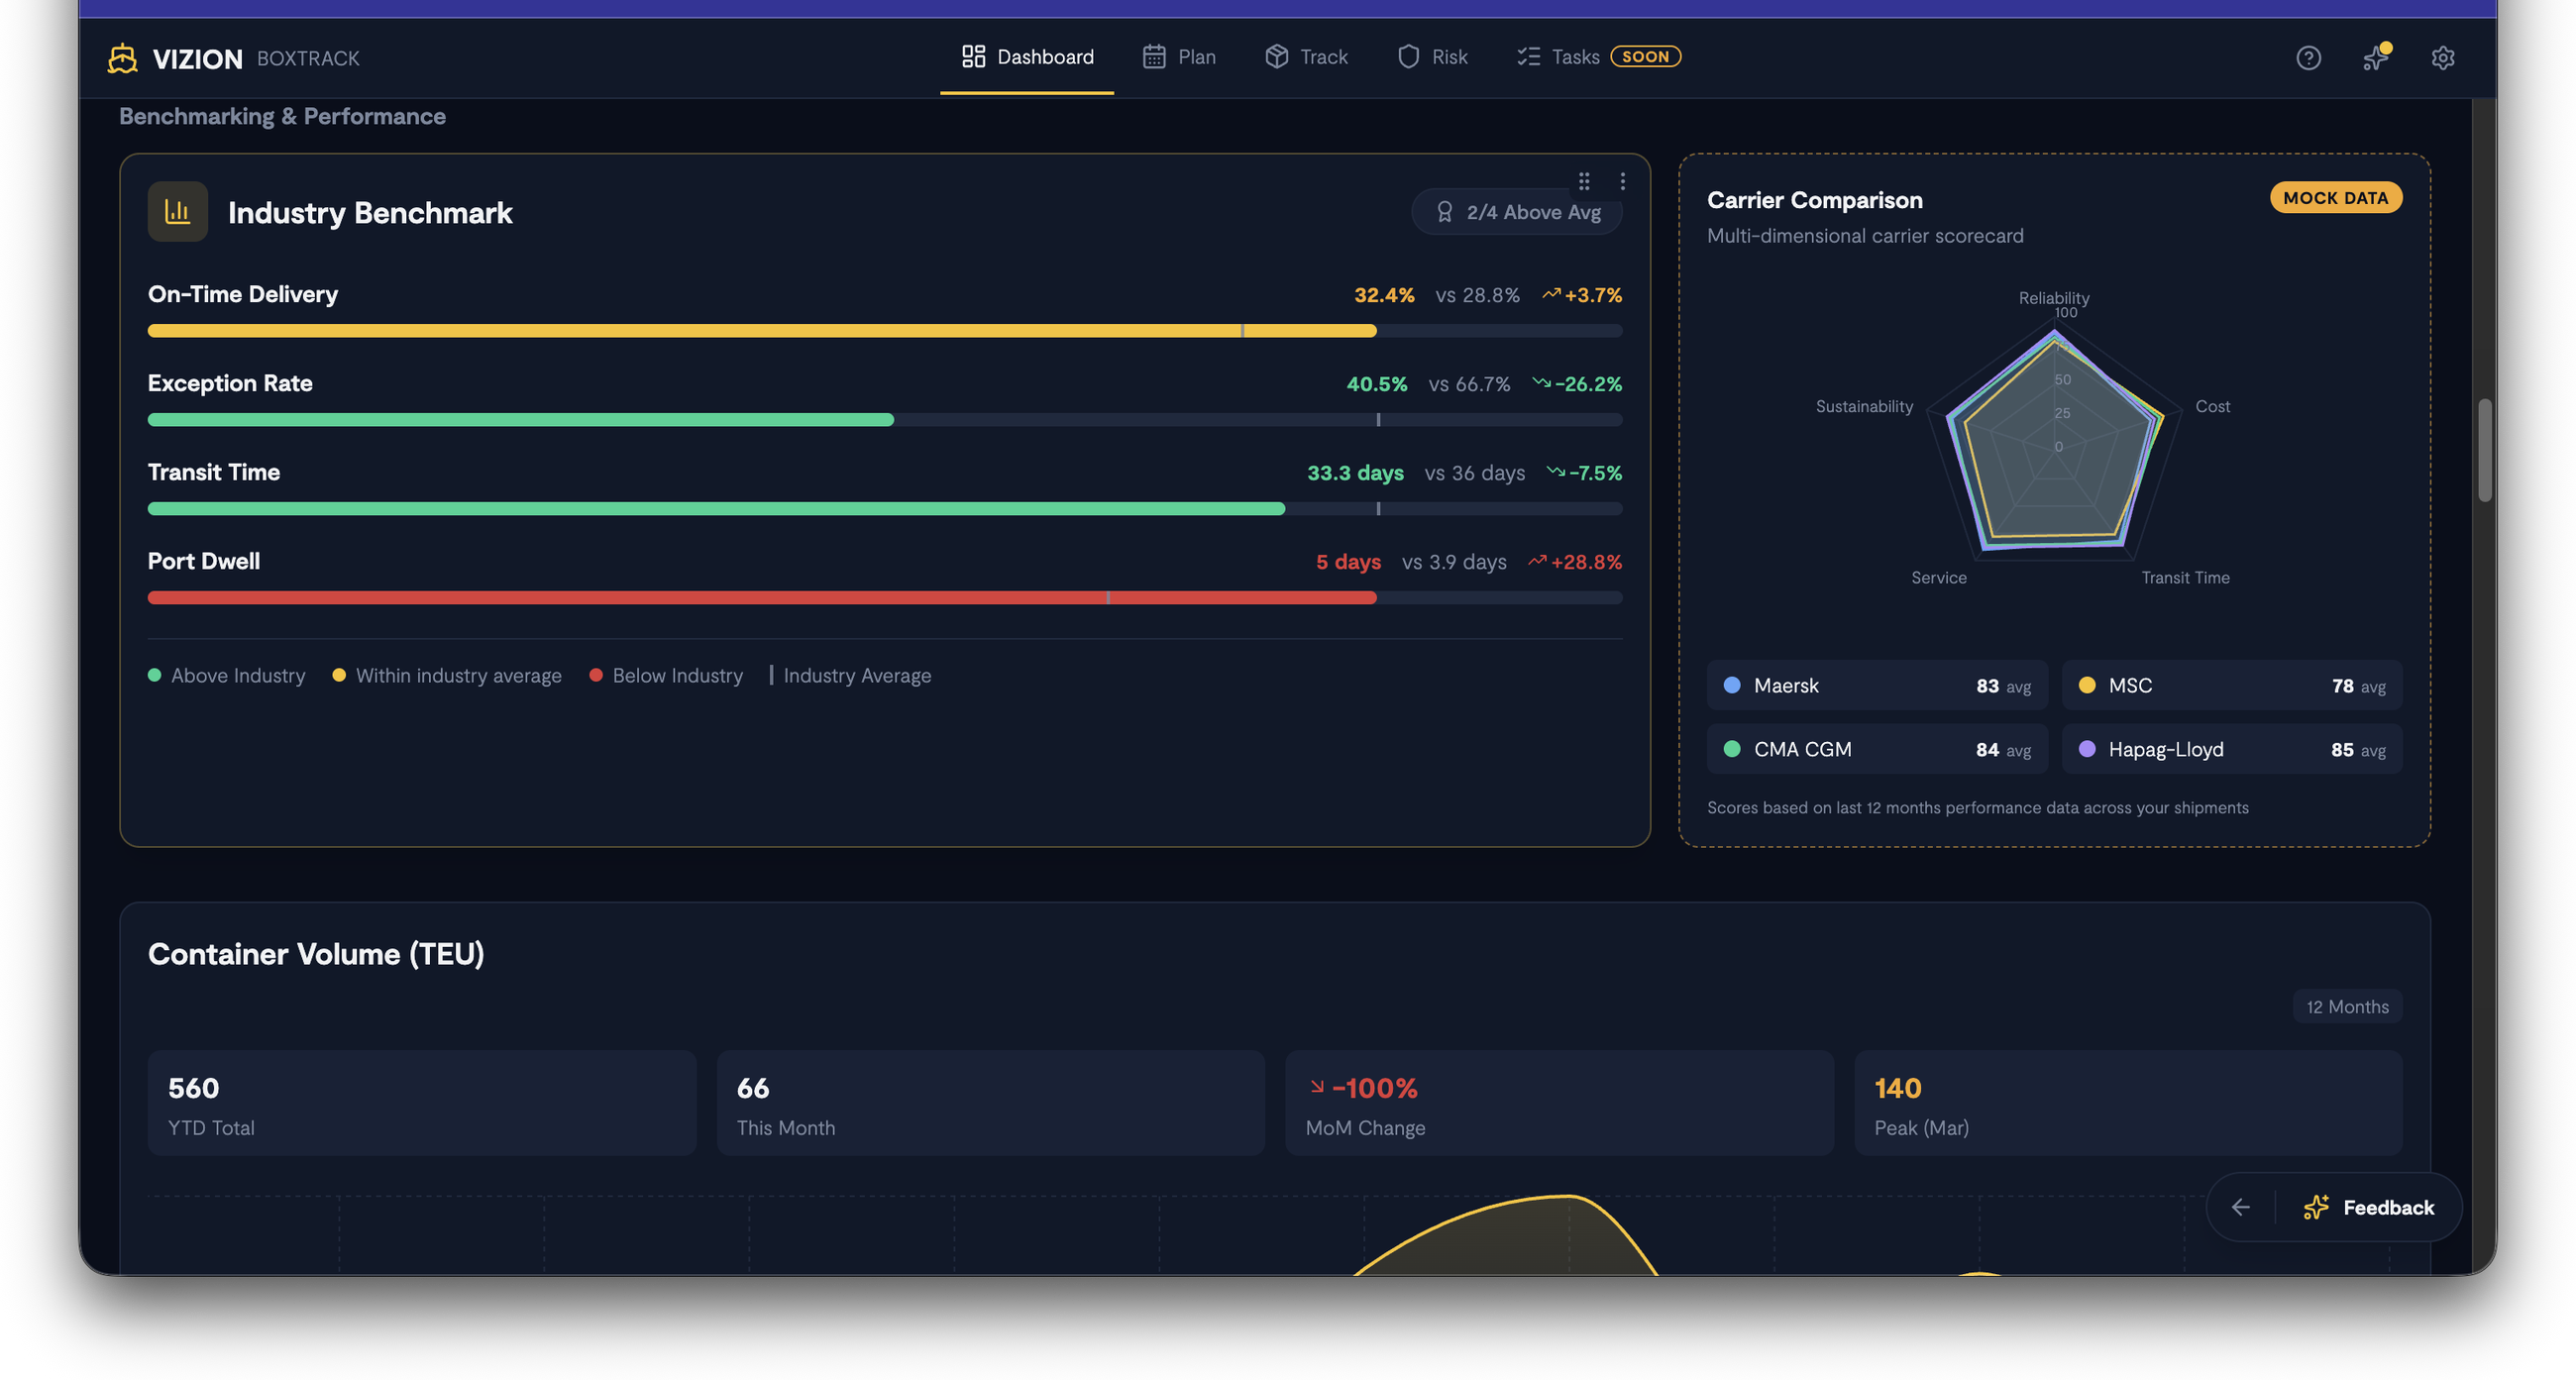
Container Volume (TEU)
A monthly volume chart showing TEU throughput over the trailing 12 months, with:
- YTD total
- Month-over-month change
- Peak month identification
- Seasonal analysis (e.g., peak season vs. off-peak average)
Port Dwell Time
A horizontal bar chart showing average dwell time in days by port, split by Import and Export direction. Includes an editable target line and highlights ports that exceed the target. Click Full Report for a detailed breakdown.
Trade Lane Performance
A detailed table of all trade lanes in your shipment data, showing:
- Volume (TEU) and share percentage
- OTD percentage
- Average delay
- Year-over-year OTD change
The table can be exported for further analysis.
Additional dashboard widgets
The dashboard includes several additional intelligence widgets. Widgets labeled Mock data are previews of upcoming features and will populate with your actual data as they become generally available:
| Widget | Description |
|---|---|
| Delay Forecast | Predictive intelligence showing shipments with high delay probability, confidence scores, and contributing factors (weather, congestion, carrier). |
| D&D Risk Countdown | Containers approaching demurrage/detention free-time expiration, sorted by cost at risk and days remaining. |
| D&D Cost Tracker | Detention and demurrage spend over 6 months, with monthly trend and at-risk container count. |
| Carrier Comparison | Multi-dimensional radar chart comparing carriers across Reliability, Cost, Transit Time, Service, and Sustainability. |
| Trade Flows | Import/export TEU volumes by region with top trade lane rankings and growth trends. |
| ETA Accuracy | Overall and per-carrier ETA accuracy percentages. |
| Blank Sailings | Weekly blank sailing rate trend and upcoming blank sailings affecting your shipments. |
| Equipment Availability | Container availability by region and equipment type (20', 40', 40'HC, Reefer). |
| Vessel Schedule Reliability | On-time vessel performance by carrier or trade lane, showing average delay hours. |
| Transit Time Distribution | Stacked bar chart showing transit time ranges by trade lane. |
| Transit Time Variability | Average transit time and standard deviation by trade lane, with variability insights. |
| Port Congestion Status | Real-time congestion data for your upcoming ports. |
| Container Volume by Type | Monthly shipment volume broken down by container type (20', 40', 40'HC, Reefer). |
| Rollover Rates by Port | Container rollover percentages by origin and transshipment ports. |
| CO₂ Emissions by Carrier | Total CO₂ emissions trend by carrier over the trailing 12 months. |
| Performance Trajectory | Two-year performance trend with projected scores for overall performance, transit time, and cost per TEU. |
| Port Rankings | Top ports ranked by composite score including OTD percentage and dwell time. |
| Port Pairs Rankings | Origin-destination port pair performance showing volume, transit time, OTD, and cost per TEU. |
Customizing the dashboard
- Reorder widgets: Hover over any widget to reveal the grip handle in the top-right corner. Drag the handle to reorder widgets within a section or move them to another section.
- Dismiss a widget: Open a widget's menu (top-right) and choose Dismiss widget to hide it. Restore it anytime from the Restore Widget option.
- Refresh: Click the refresh button next to the time range selector to reload all widget data.
Plan
The Plan section helps you search sailing schedules, compare carrier services, and optimize your shipping routes.
Search Services
Search for available sailings between any two ports:
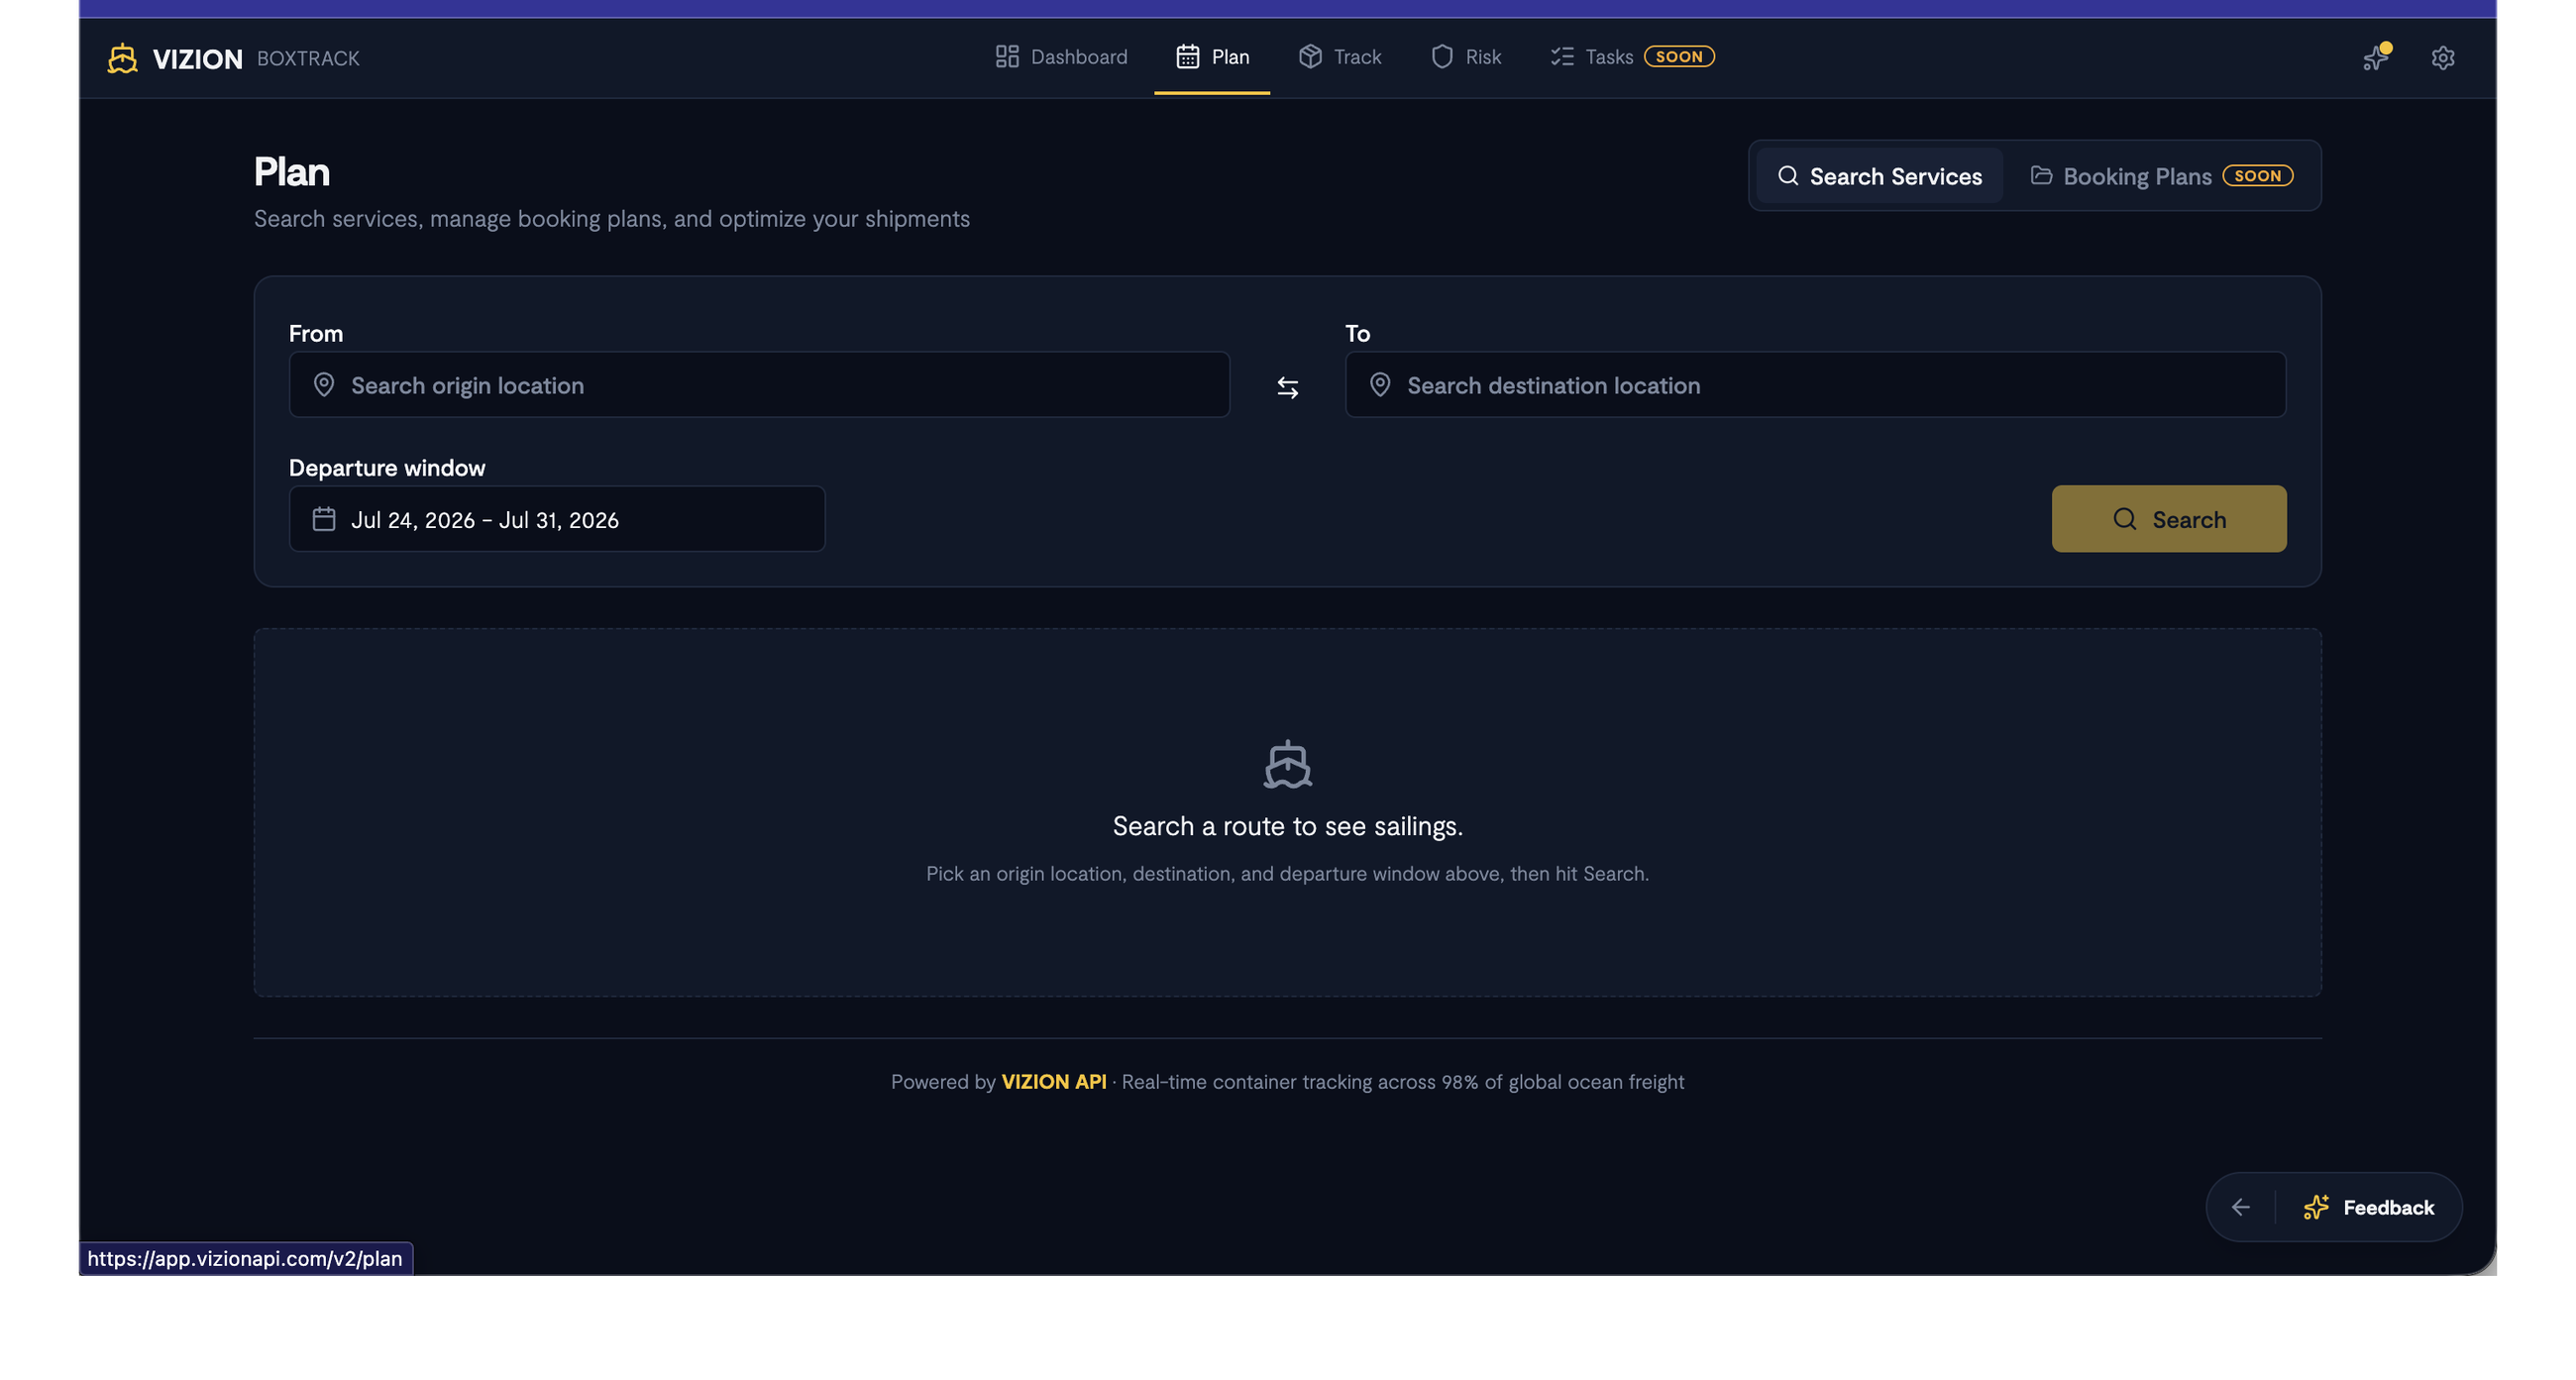
- Enter an origin location in the "From" field. The search supports ports and terminals with autocomplete, displaying port codes and countries.
- Enter a destination location in the "To" field. Use the swap button to reverse origin and destination.
- Select a departure window (date range).
- Click Search.
Schedule Results
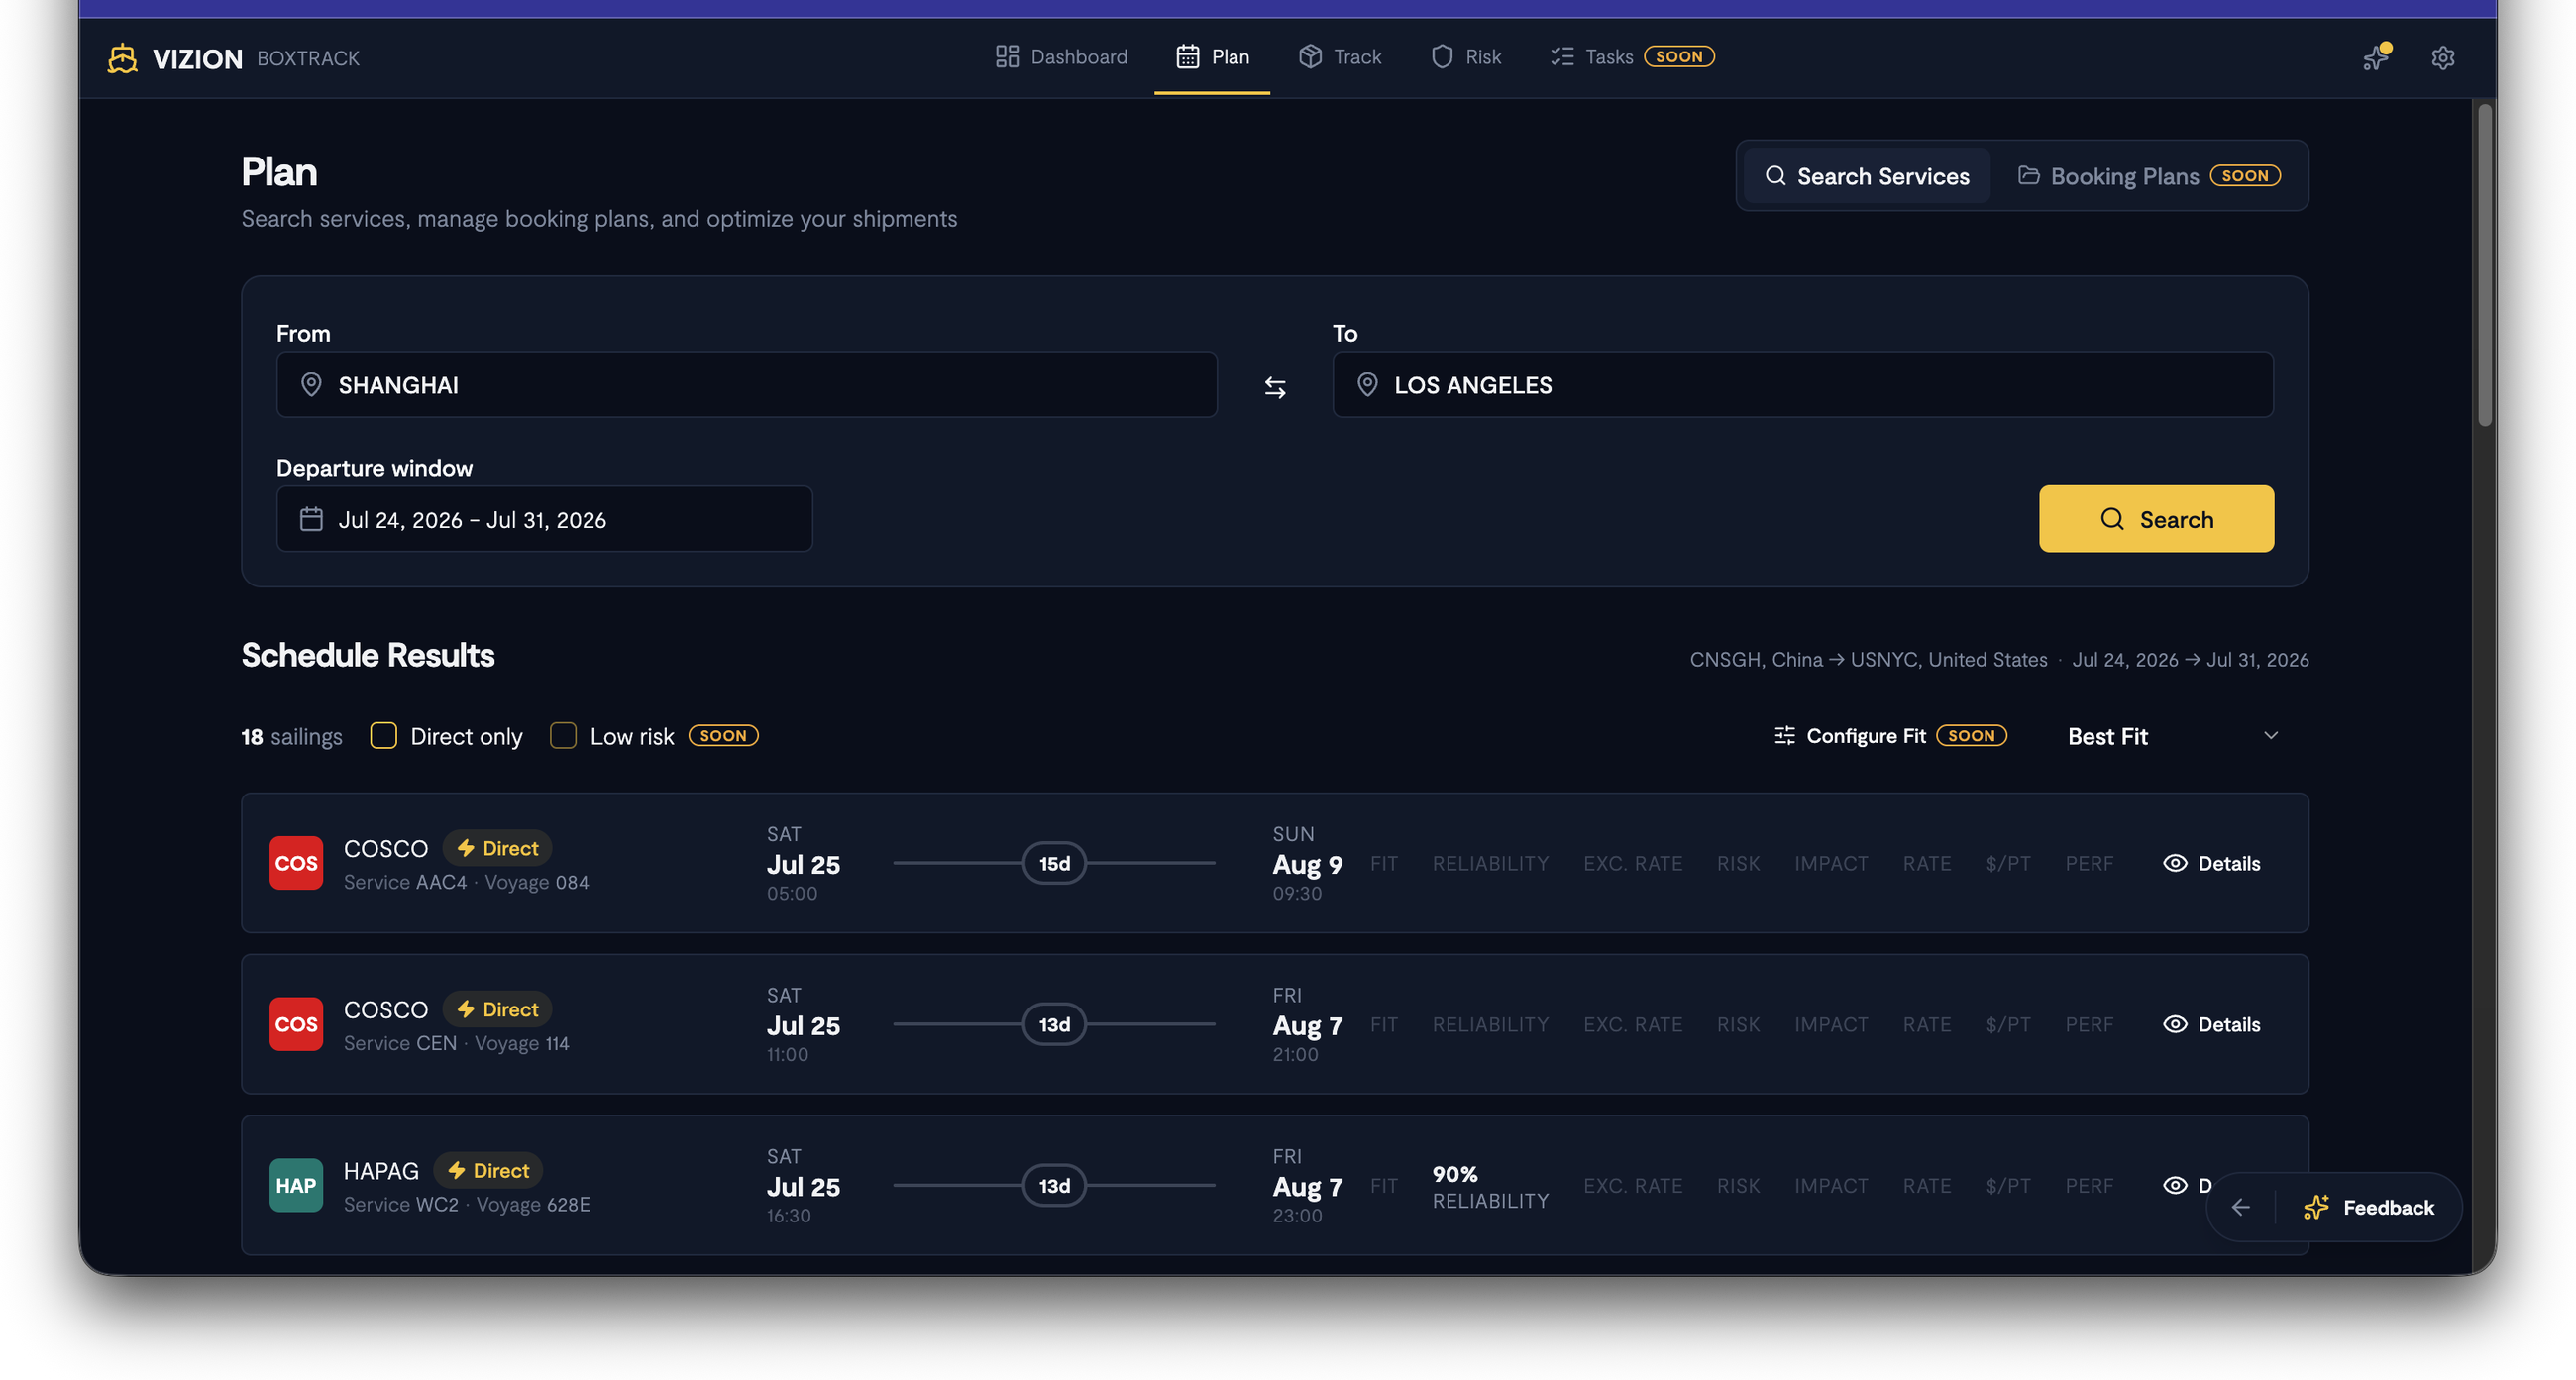
Results display all matching sailings with the following details for each:
- Carrier name and logo
- Service name and Voyage number
- Direct indicator (for non-transshipment routes)
- Departure date/time and arrival date/time
- Transit time in days
- Performance metrics (populated as data becomes available):
- FIT (service fit score)
- RELIABILITY percentage
- EXC. RATE (exception rate)
- RISK, IMPACT, RATE, $/PT, PERF
Filtering and sorting results
- Direct only: Check this box to show only non-transshipment sailings.
- Low risk: (Coming soon) Filter for low-risk sailings.
- Configure Fit: (Coming soon) Customize how the FIT score is calculated based on your priorities.
- Sort by: Best Fit (default) or other sorting options.
Better Performance Alternatives
Below the results, BoxTrack may suggest nearby port pairs with equal or better reliability than your searched route, showing distance from your original ports, reliability comparison, and service characteristics.
Sailing details
Click Details on any sailing to expand additional information about the service, including route details and historical performance.
Booking Plans
(Coming soon) Manage and organize booking plans directly within BoxTrack.
Track
The Track section is your central shipment tracking workspace. Every container and air waybill (AWB) you follow appears here in one searchable, filterable list.
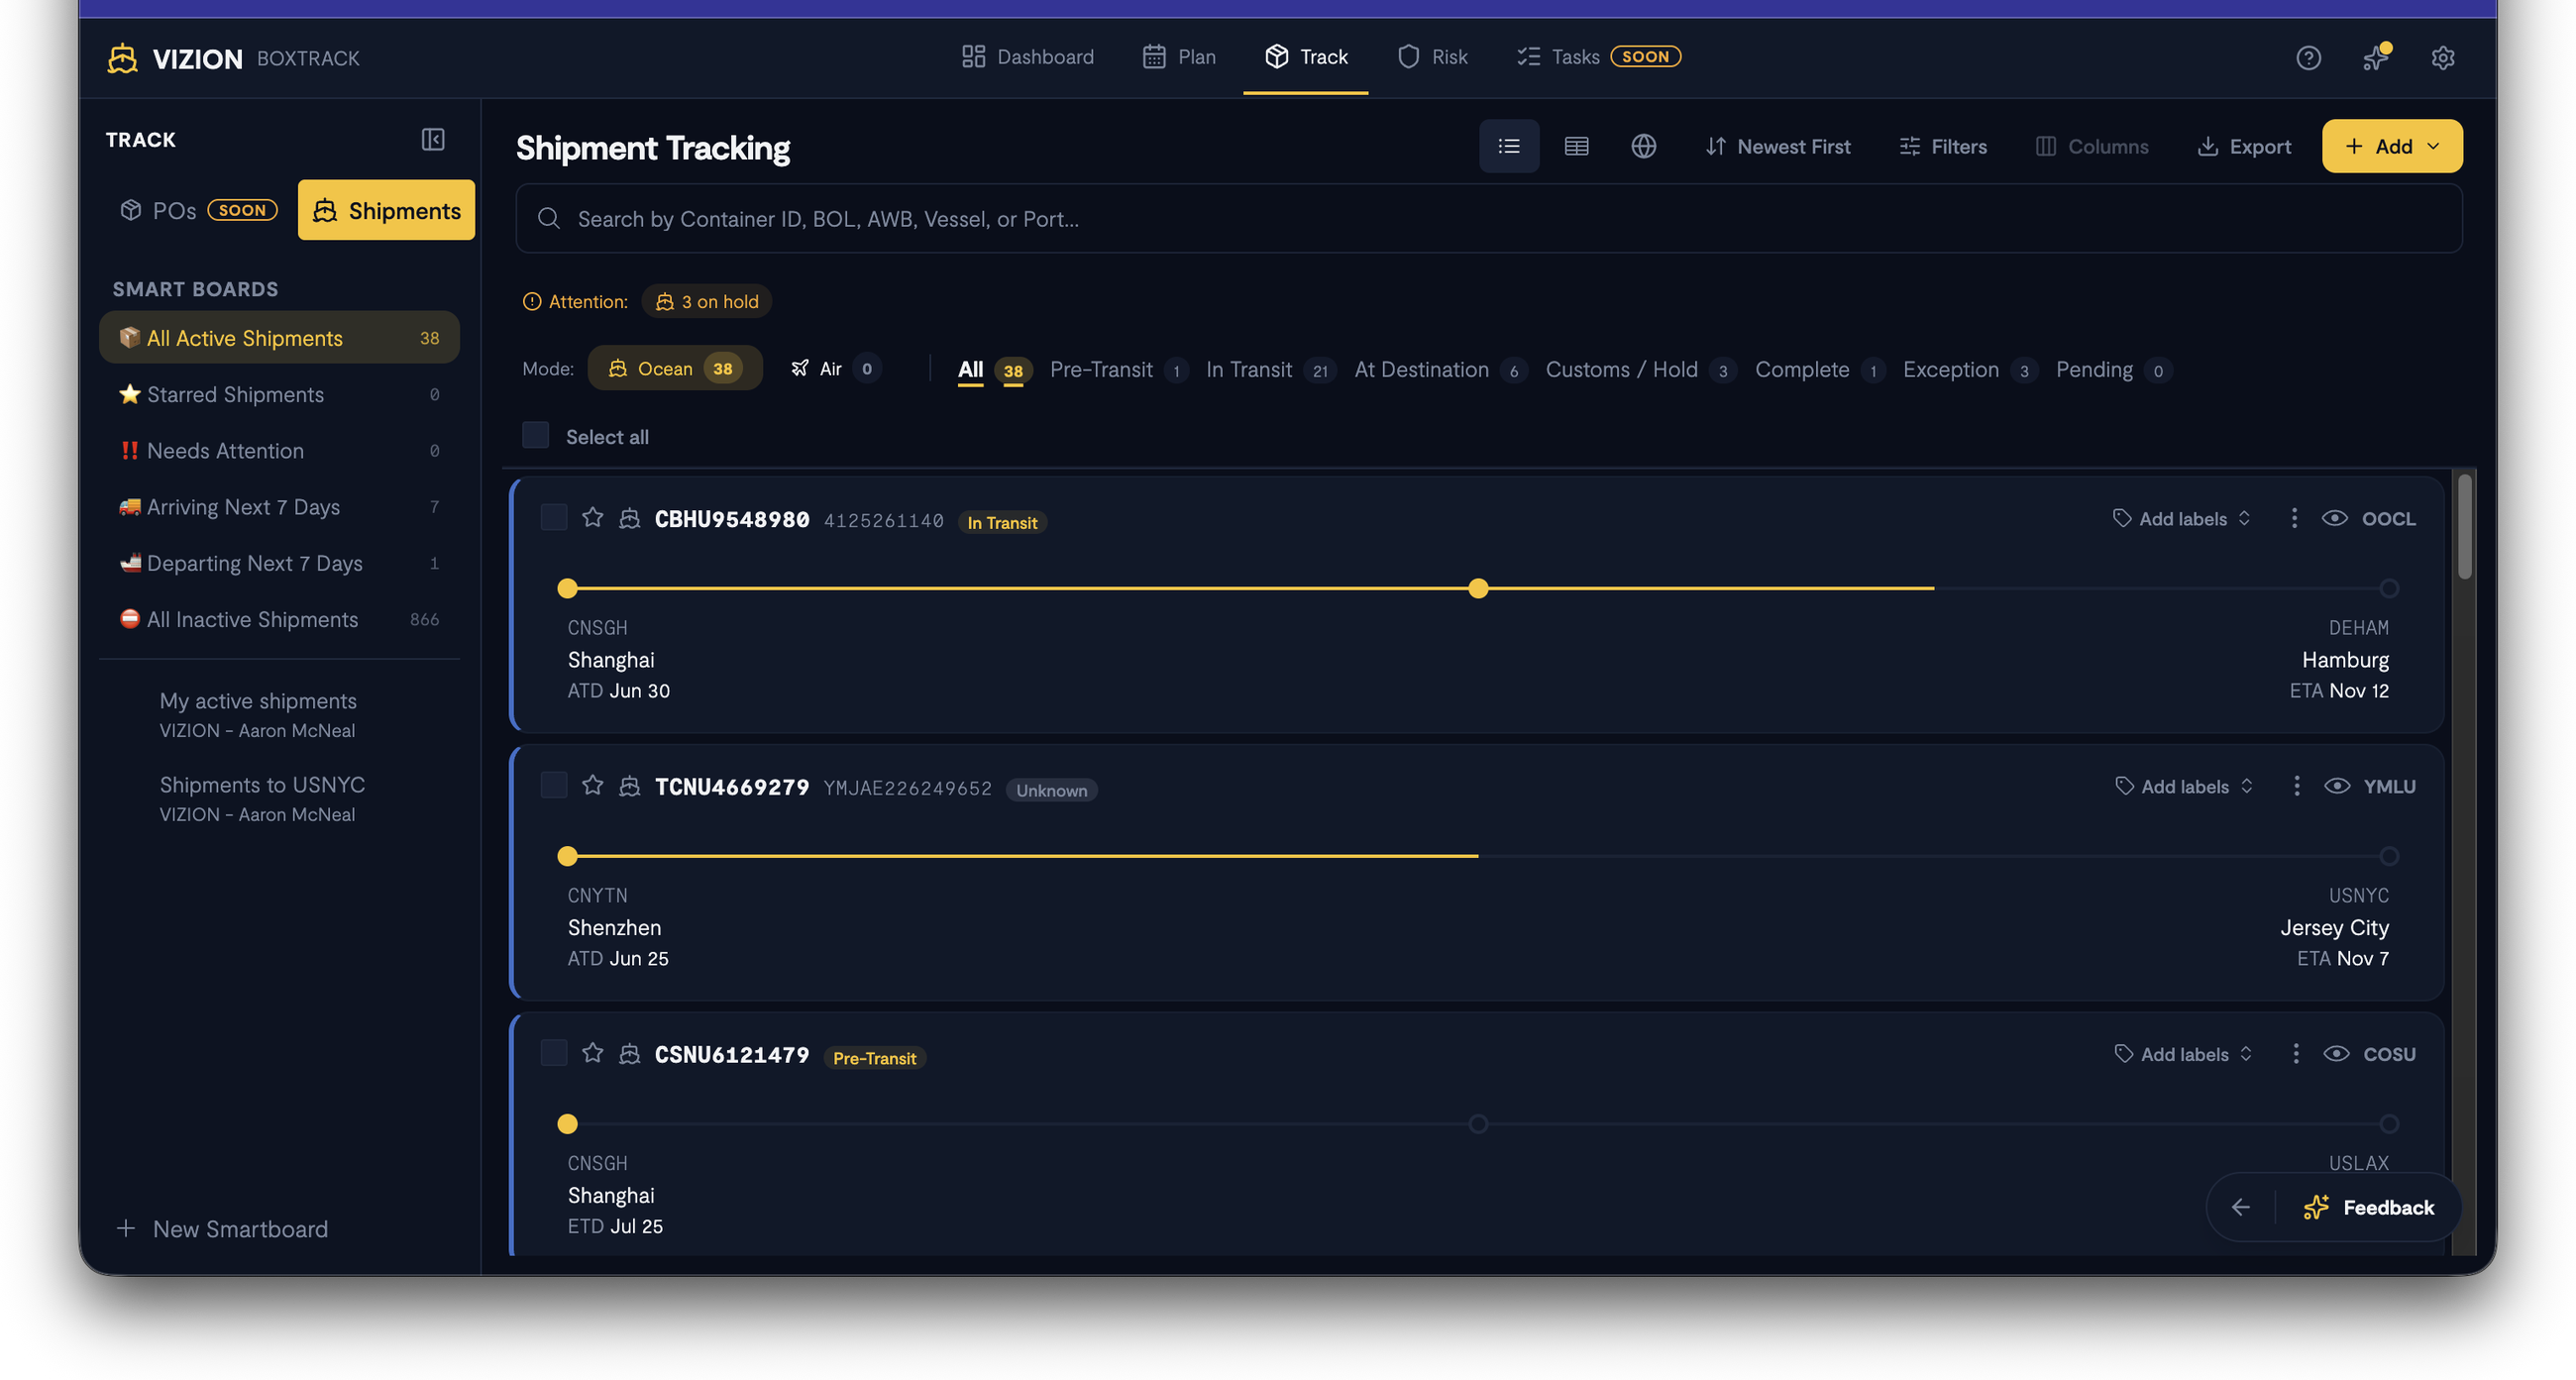
Transport modes
Switch between Ocean and Air tracking using the mode selector. The shipment list, Smart Boards, and filters all adapt to the selected mode, keeping each transport type in its own view.
Adding shipments
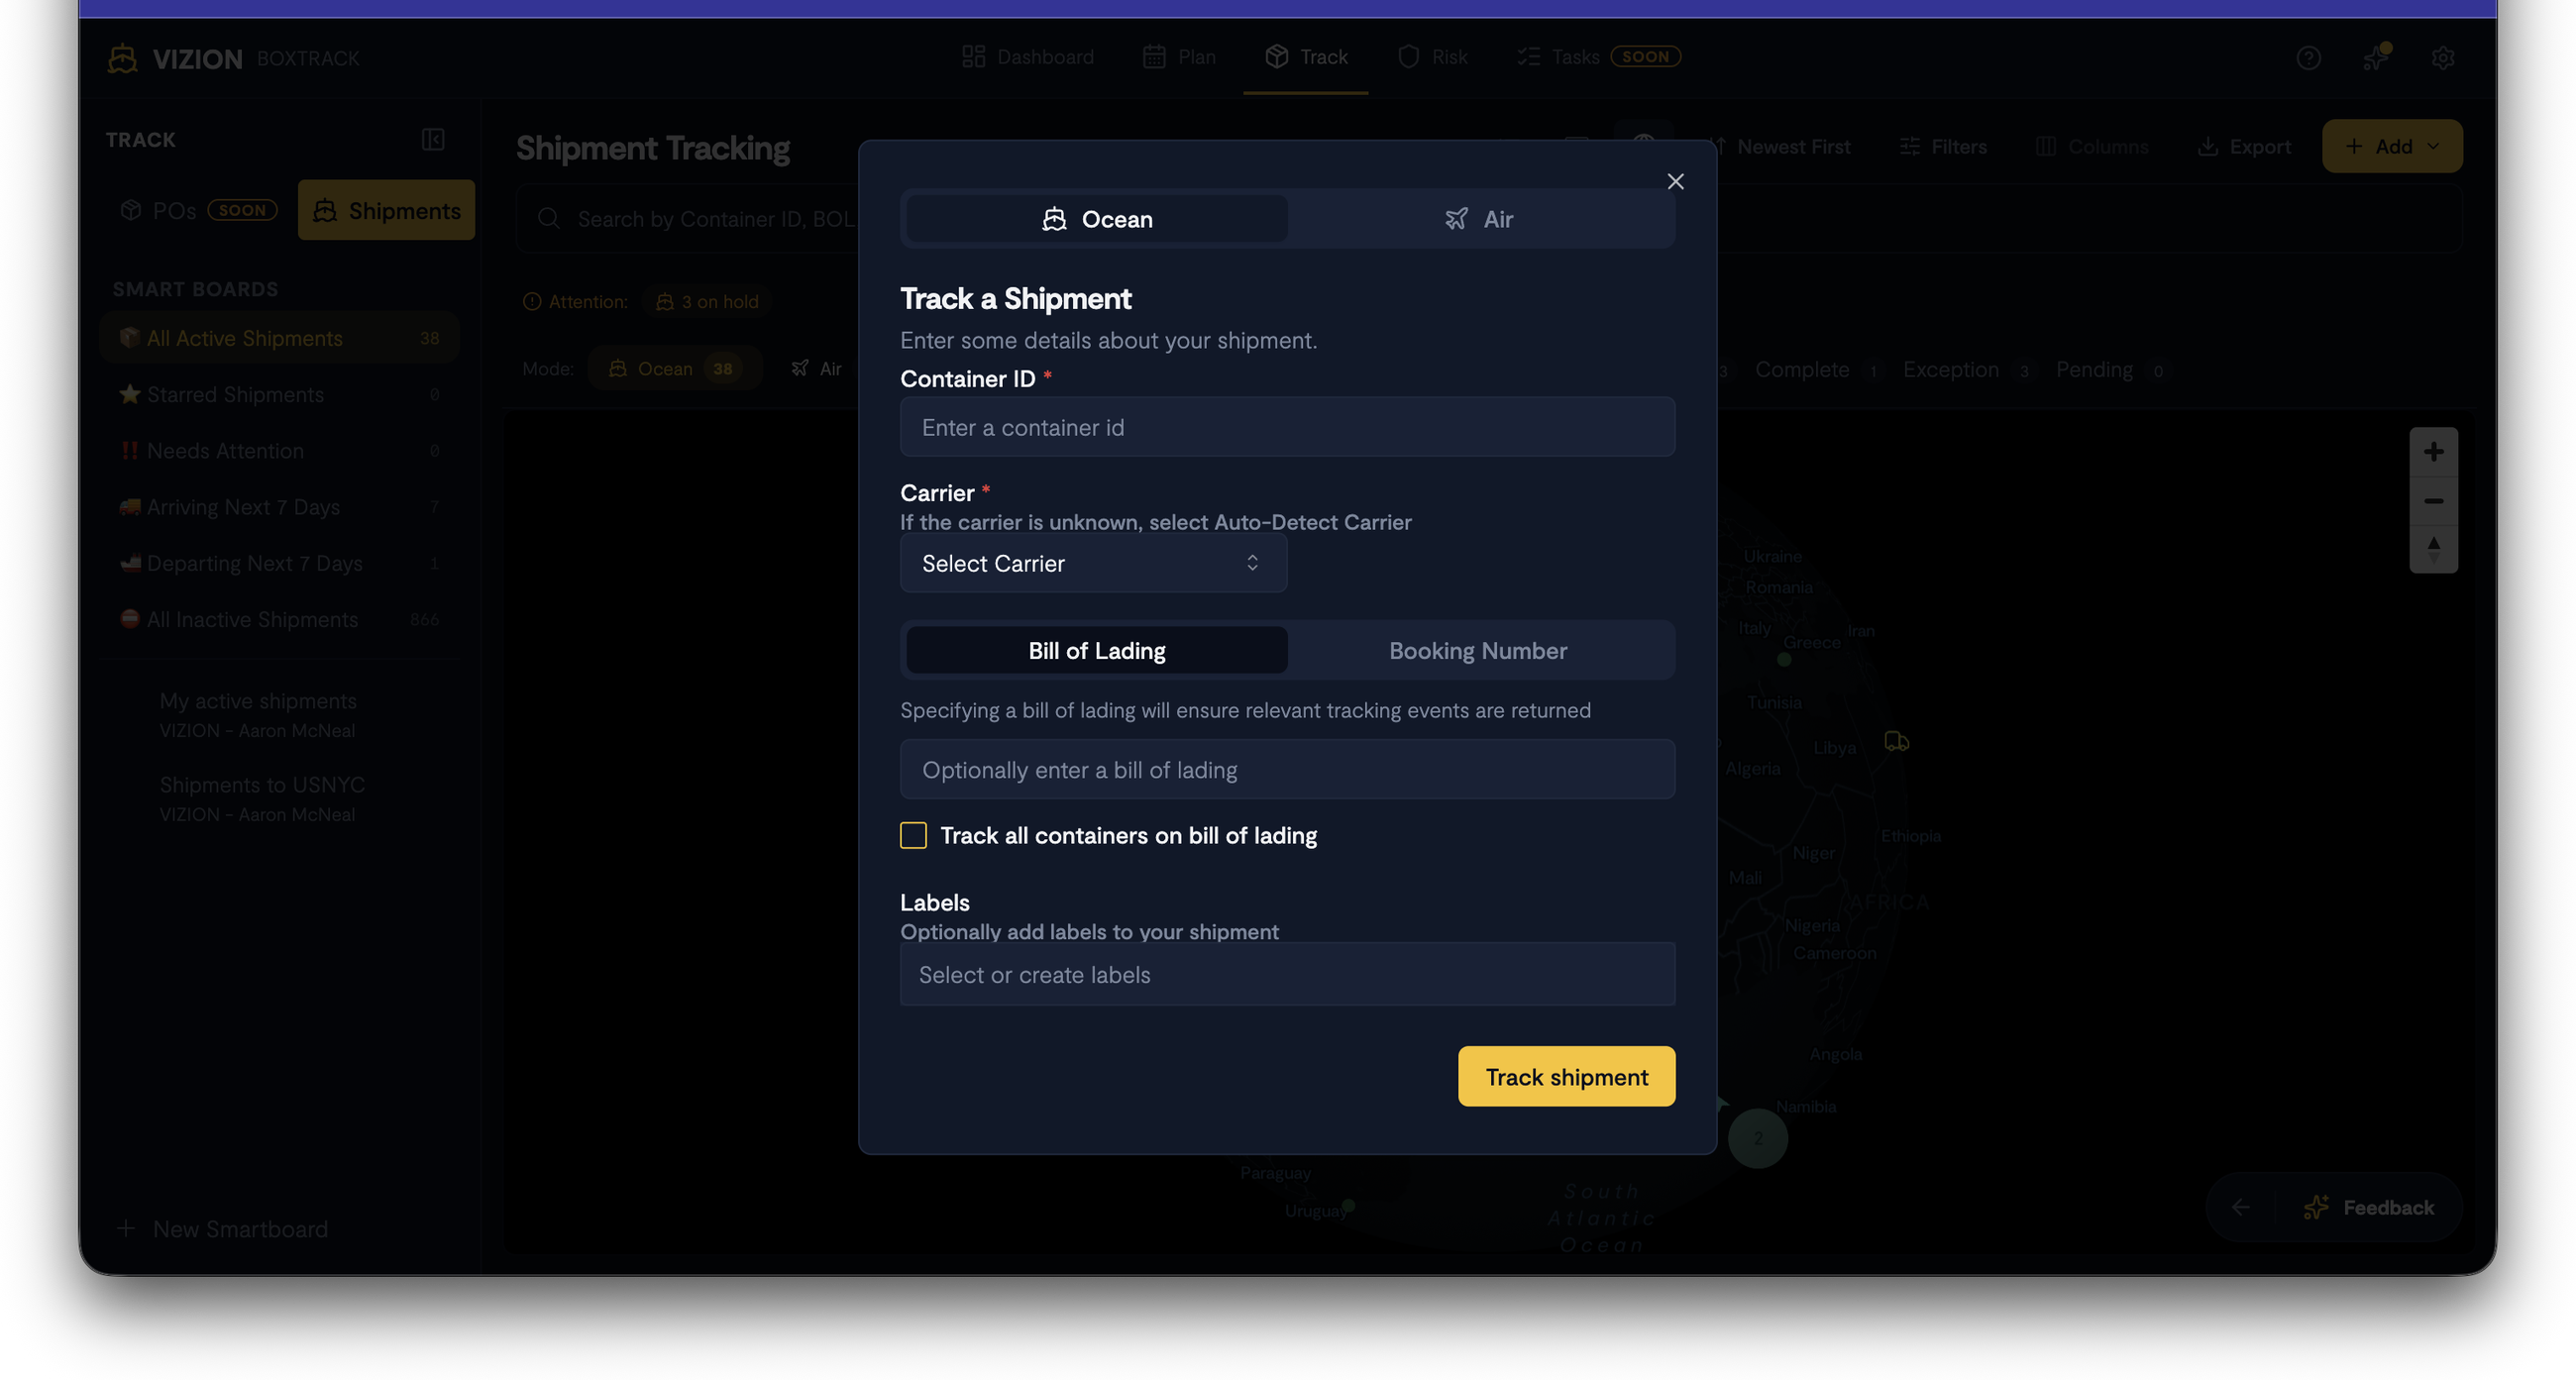
Click the + Add button in the toolbar to track a new shipment. You can:
- Track a single container: Enter the container number (e.g., CSNU0001111) and optionally select a carrier or use auto carrier identification.
- Track by Bill of Lading: Enter a container ID along with the Master BOL. Optionally select "Track all containers on master BOL" to return tracking for every container on the bill.
- Bulk import: Upload a CSV file with multiple containers. A sample template is available for download.
Shipment list views
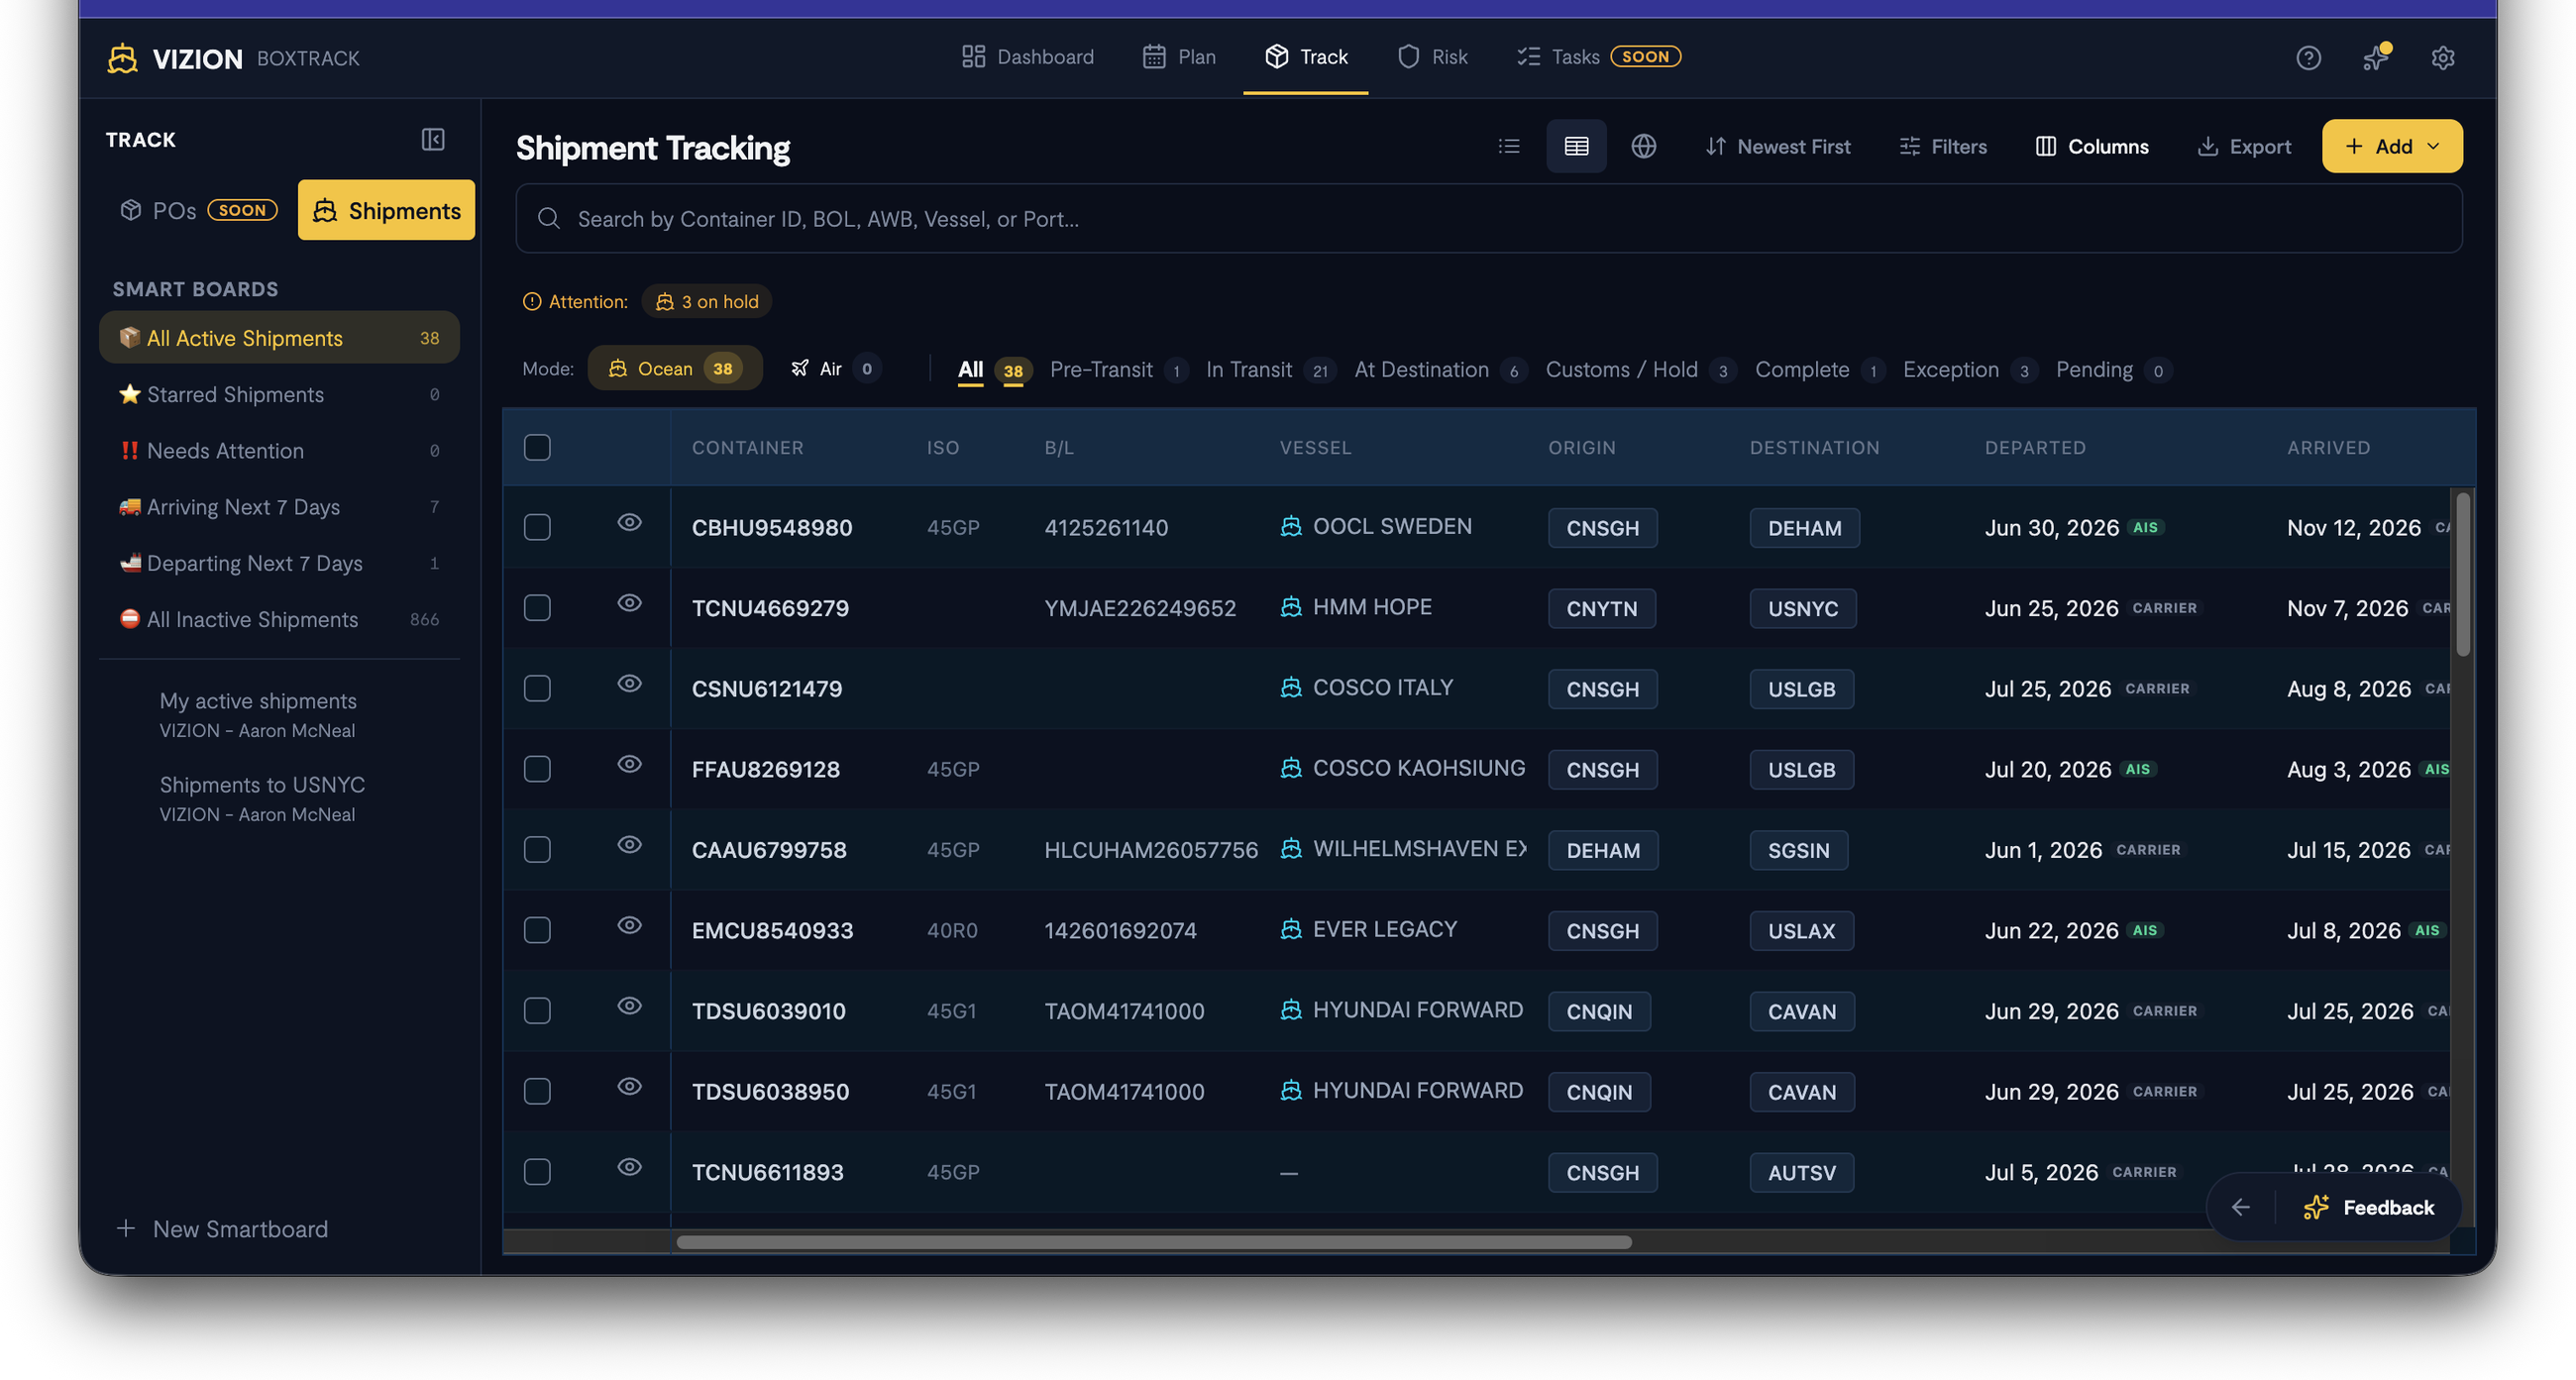
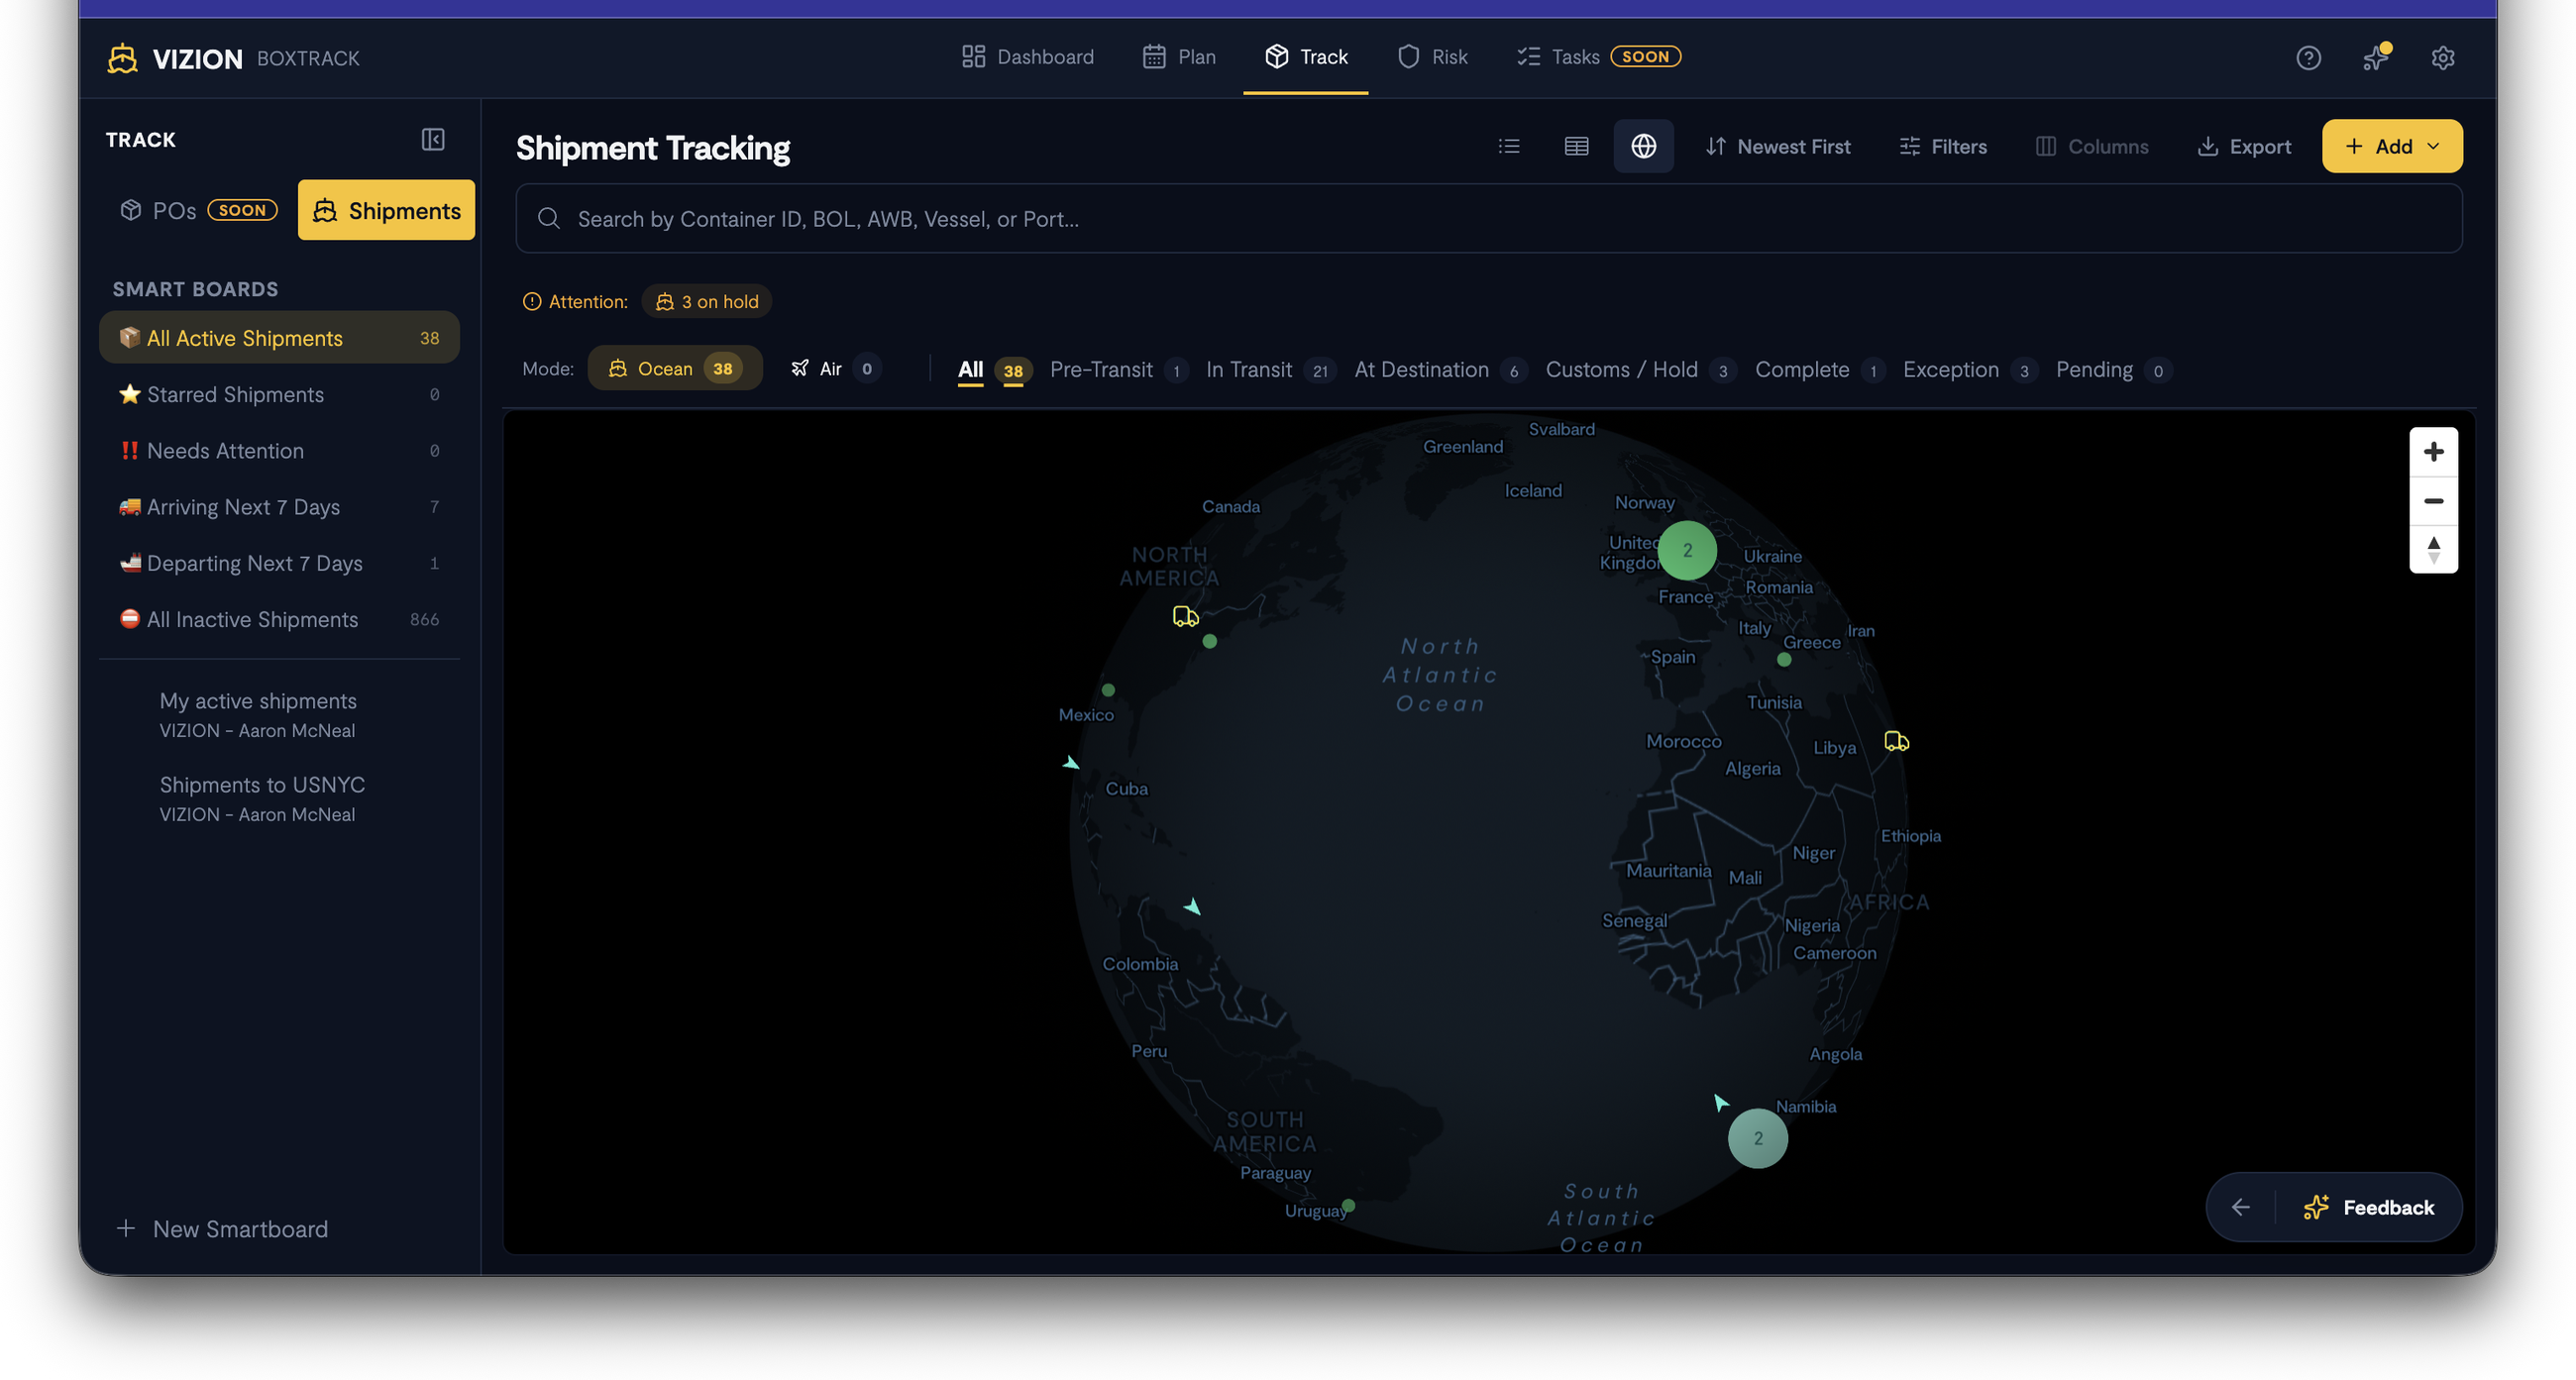
Toggle between three view modes using the toolbar:
- List view: Card-based view showing each shipment with a visual progress bar, origin/destination ports, ATD/ETA dates, status badge, carrier, and labels.
- Table view: Spreadsheet-style tabular view with sortable columns.
- Map view: Geographic view plotting shipments on a map.
Status filters
Filter shipments by their current journey phase using the status tabs:
| Status | Description |
|---|---|
| All | All shipments regardless of status. |
| Pre-Transit | Shipments not yet departed from origin. |
| In Transit | Shipments currently en route. |
| At Destination | Shipments that have arrived at the destination port. |
| Customs / Hold | Shipments held at customs or otherwise on hold. |
| Complete | Shipments that have completed their journey. |
| Exception | Shipments with exceptions (delays, rollovers, etc.). |
| Pending | Shipments awaiting initial tracking data. |
An Attention indicator appears when shipments require action (e.g., containers on hold).
Search
Use the search bar to find shipments by Container ID, BOL, AWB, Vessel name, or Port.
Sorting, filtering, and columns
- Sort: Choose sort order (e.g., Newest First) from the toolbar dropdown.
- Filters: Apply advanced filters to refine the shipment list.
- Columns: Customize which data columns are visible in Table view.
- Export: Export your current shipment view for external analysis.
Smart Boards
Smart Boards are saved shipment views that let you jump between filtered sets with one click. The sidebar displays both built-in and custom boards:
Built-in Smart Boards:
| Board | What it shows |
|---|---|
| All Active Shipments | Every shipment currently being tracked. |
| Starred Shipments | Shipments you have starred/favorited. |
| Needs Attention | Shipments with exceptions or issues requiring action. |
| Arriving Next 7 Days | Shipments with an ETA within the next week. |
| Departing Next 7 Days | Shipments with a departure date within the next week. |
| All Inactive Shipments | Completed or unsubscribed shipments. |
Custom Smart Boards:
Create your own Smart Boards to organize shipments by project, customer, region, or any criteria:
- Click + New Smartboard at the bottom of the sidebar.
- Configure filters and sorting.
- Name your board.
- The board appears in the sidebar for one-click access.
Tip: Filter your list the way you like, then save it as a Smart Board to return to it instantly.
Labels
Labels are free-text tags you can assign to shipments for custom organization. Click Add labels on any shipment to create or apply labels.
Example use cases:
- Urgent: Track shipments requiring priority handling.
- Europe Imports: Group all shipments destined for European ports.
- At risk: Track shipments at risk for additional port fees.
Purchase Orders
(Coming soon) The POs tab will allow you to track shipments at the purchase order level.
Shipment detail
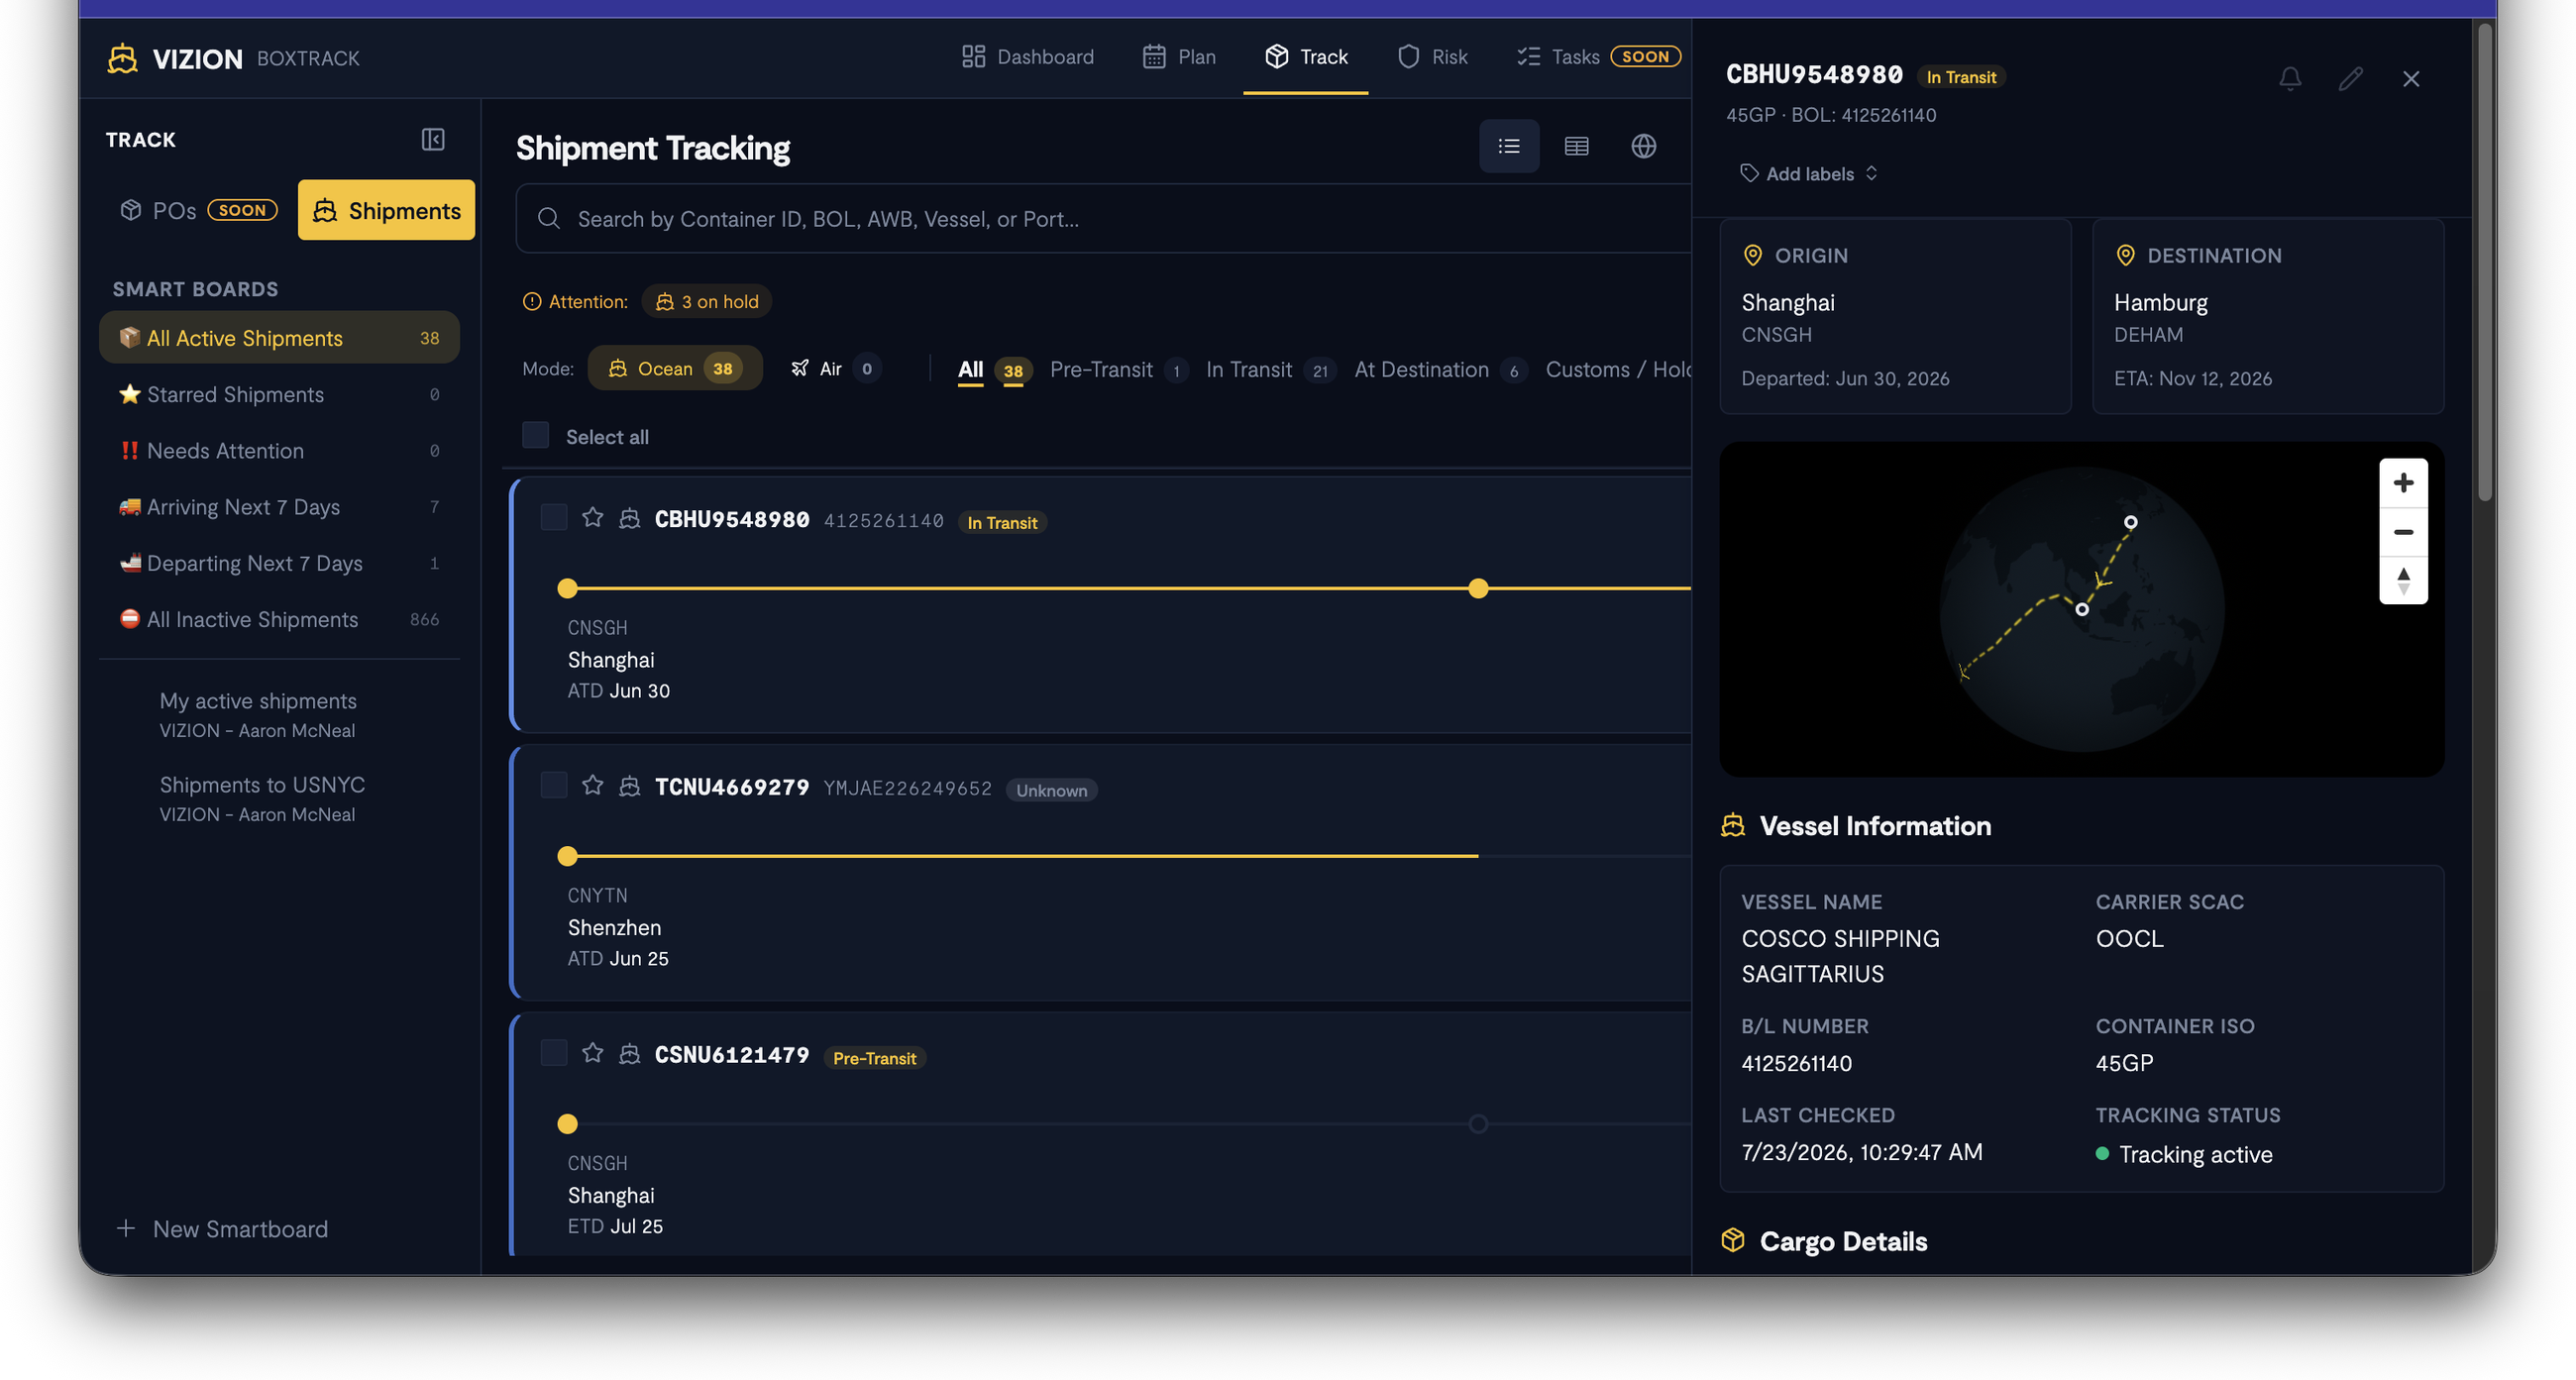
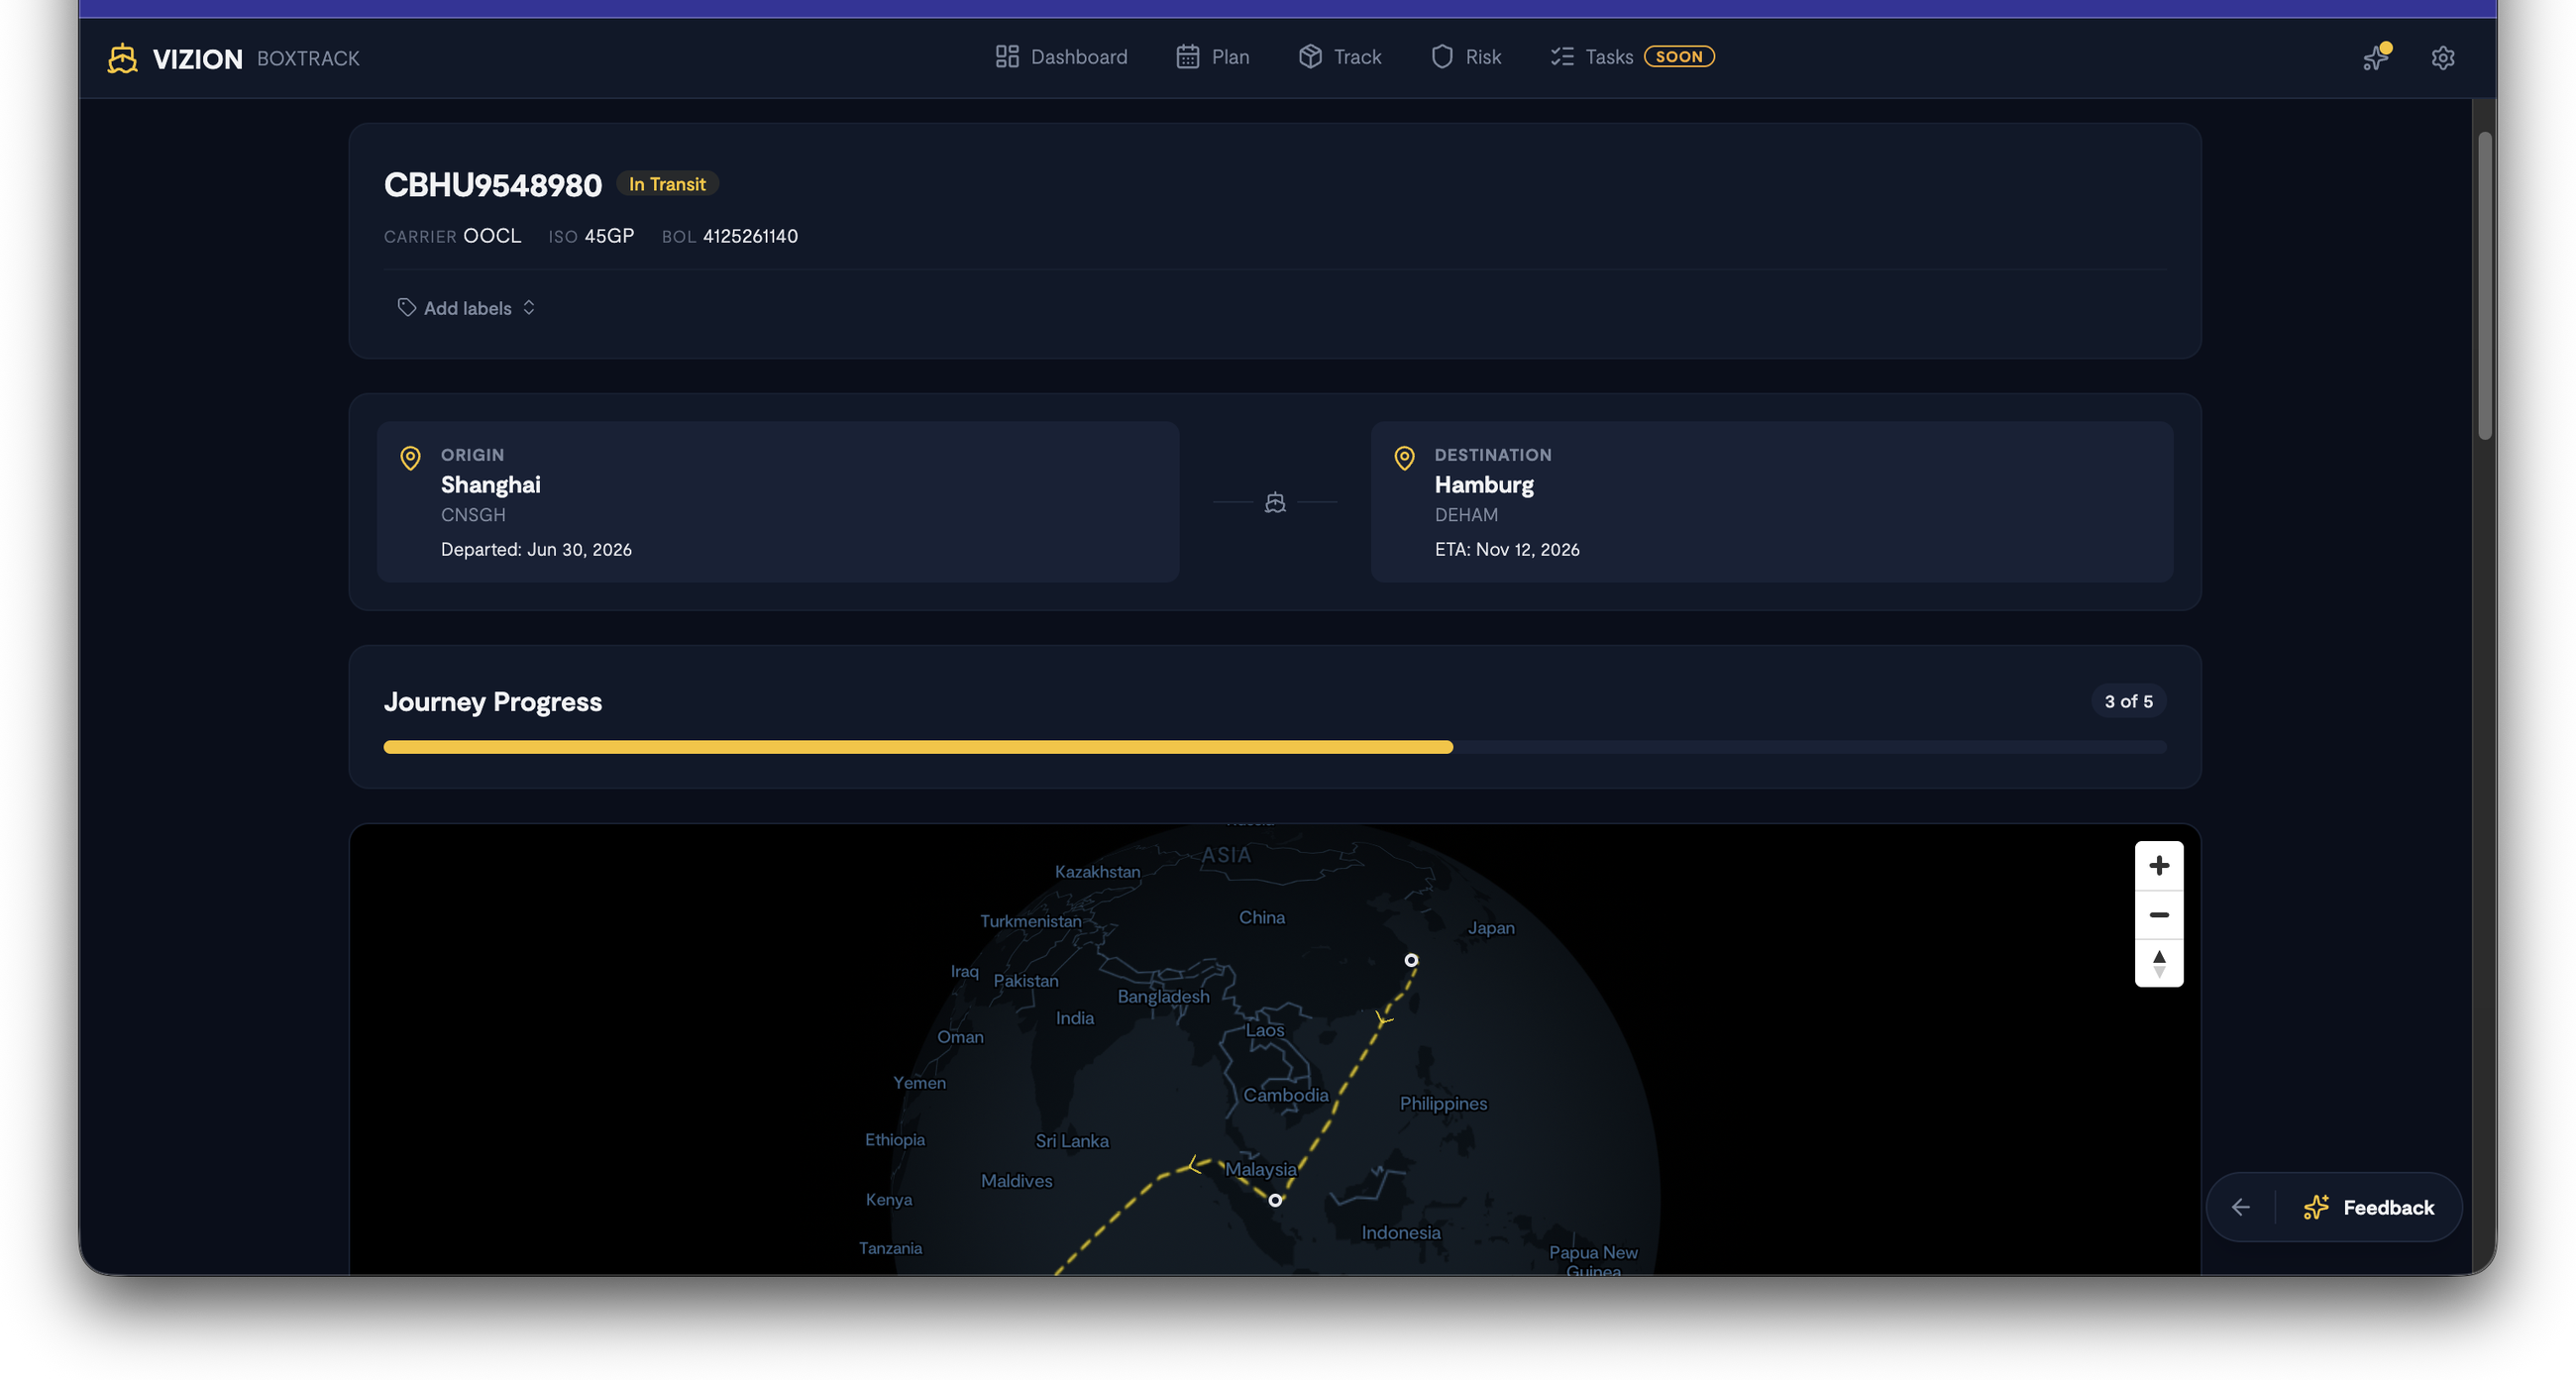
Click any shipment in the Track list to open its detail panel, or click Full Details to open the full-page view.
Header
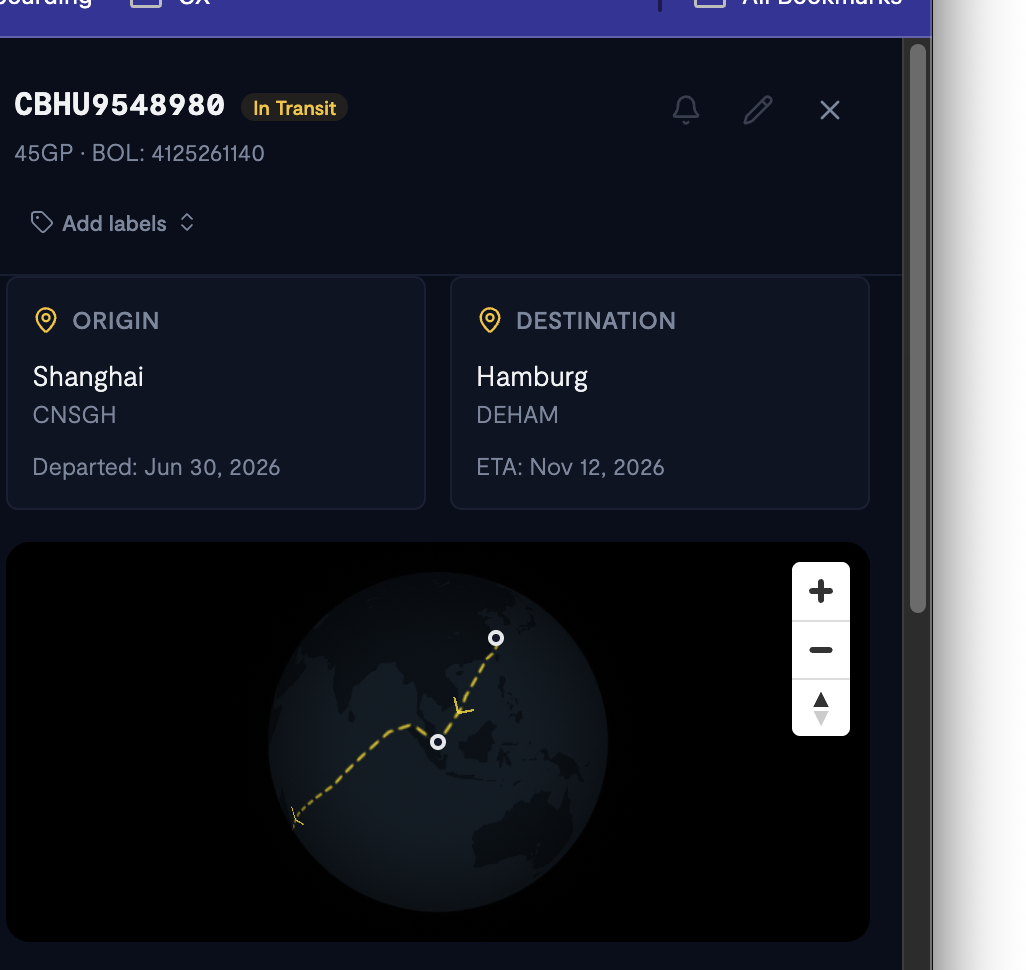
The shipment header displays:
- Container ID and status badge (e.g., In Transit, Pre-Transit, Complete)
- Carrier SCAC, Container ISO type, and Bill of Lading number
- Labels (add or manage)
- Share button to share the shipment view
- Notification bell to configure alerts for this shipment
Route summary
A visual card showing:
- Origin: Port name, UN/LOCODE, and departure date (ATD)
- Destination: Port name, UN/LOCODE, and estimated arrival (ETA)
Journey Progress
A progress bar showing how many of the expected journey milestones have been completed (e.g., "3 of 5 milestones").
Map
An interactive map (or globe view in full-page mode) displaying the shipment's route from origin to destination, with the vessel's current position plotted along the path. Zoom controls are available.
Vessel Information
| Field | Description |
|---|---|
| Vessel Name | The name of the vessel carrying the container. |
| Carrier SCAC | The carrier's Standard Carrier Alpha Code. |
| B/L Number | The Bill of Lading number associated with the shipment. |
| Container ISO | The container type classification code (e.g., 45GP). |
| Last Checked | Timestamp of the most recent tracking data check. |
| Tracking Status | Whether tracking is currently active for this shipment. |
Cargo Details
| Field | Description |
|---|---|
| Weight | Total cargo weight in kilograms. |
| Quantity | Number of cargo units (e.g., cartons). |
| VGM | Verified Gross Mass of the container. |
Milestone Timeline
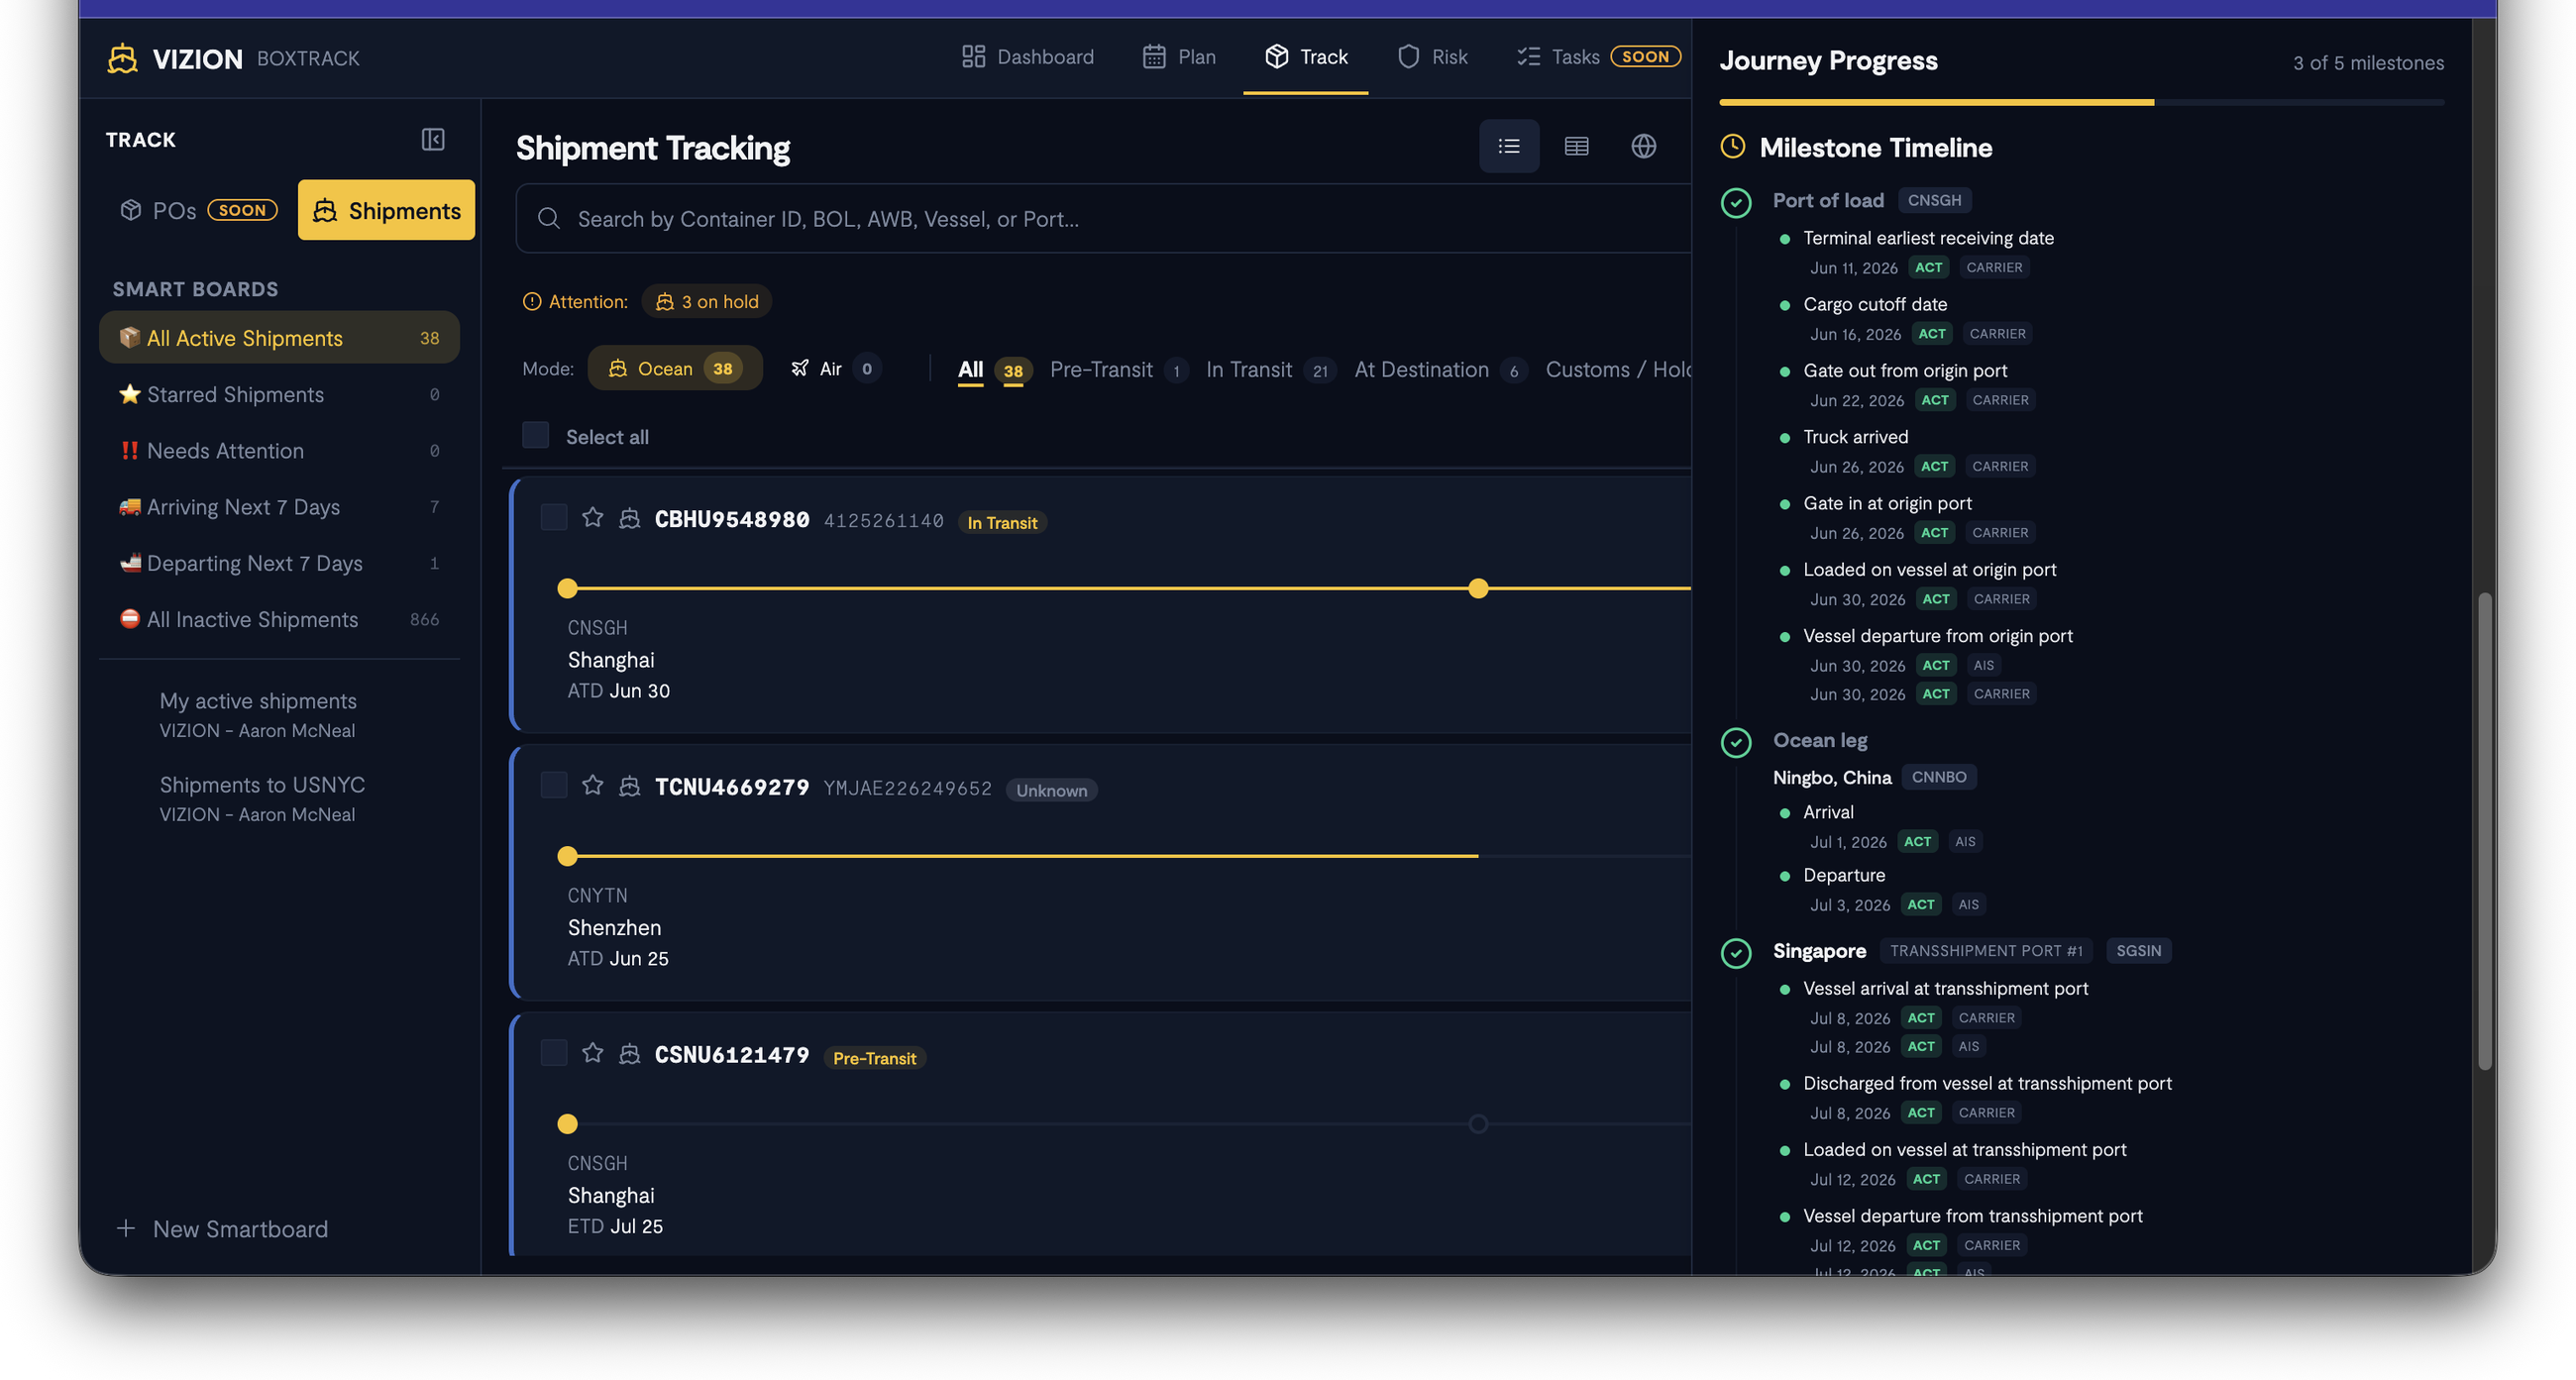
The milestone timeline provides a chronological record of every event in the container's journey. Events are grouped by location:
- Port of load: Gate out, truck arrived, gate in, loaded on vessel, vessel departure, etc.
- Ocean legs: Arrival and departure at intermediate ports.
- Transshipment ports: Vessel arrival, discharge, reload, and departure at transshipment hubs (labeled as "Transshipment Port #1", "#2", etc.).
- Port of discharge: Vessel arrival, discharge, and inland delivery events.
Each milestone entry shows:
- Event name (e.g., "Loaded on vessel at origin port")
- Date
- Status tag: ACT (actual/confirmed) or EST (estimated)
- Data source: CARRIER, AIS (Automatic Identification System), or VIZION (Vizion's own estimate)
A full list of standardized tracking milestones is available in the Standardized milestone events documentation.
Risk Briefs
The Risk section surfaces curated intelligence on events affecting global supply chains, helping you stay ahead of disruptions.
Overview
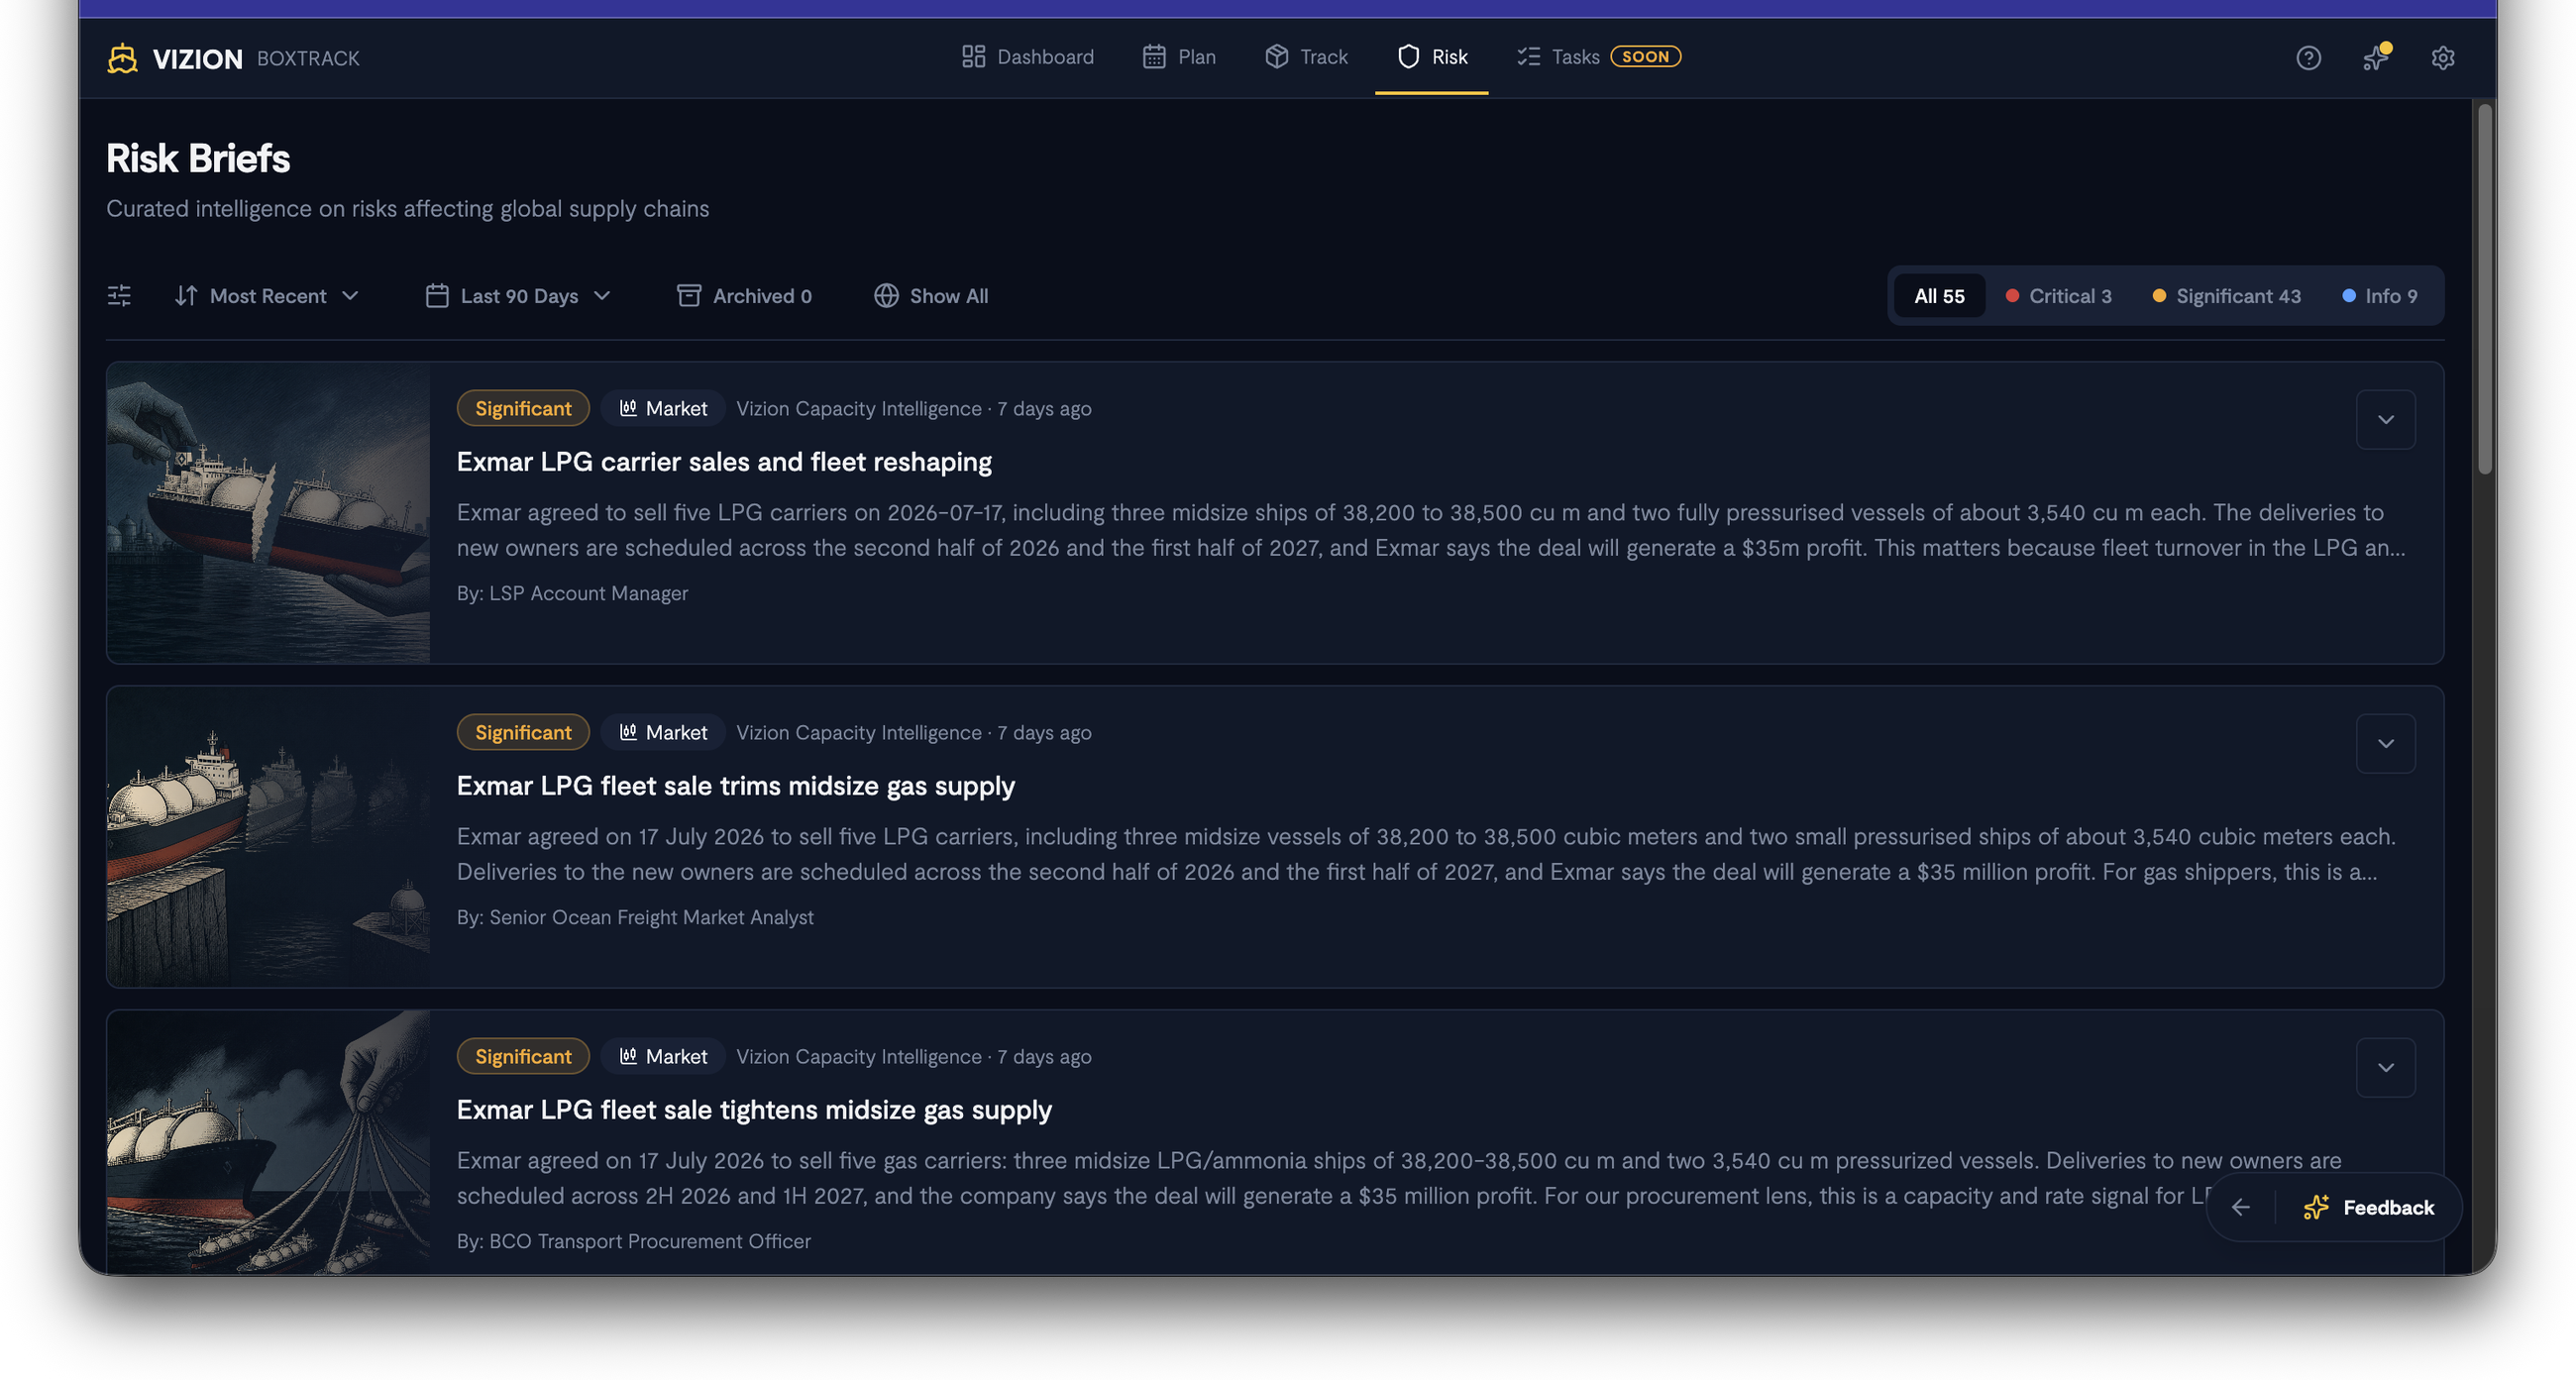
Risk Briefs are AI-generated intelligence reports covering market events, port disruptions, carrier changes, and operational risks. Each brief includes:
- Severity badge: Critical, Significant, or Info
- Category tag: e.g., Market, Operational
- Source: e.g., Vizion Capacity Intelligence, Vizion Port Intelligence
- Timestamp: When the brief was published
- Headline and summary: Concise description of the risk event
- Byline: The perspective from which the brief is written (e.g., BCO Transport Procurement Officer, LSP Carrier Procurement Executive)
- Hero image: Visual context for the event
Filtering risk briefs
- Sort: Most Recent (default) or other ordering options.
- Time range: Filter by recency (e.g., Last 90 Days).
- Severity tabs: All, Critical, Significant, or Info to focus on the urgency level that matters most.
- Geographic filter: Use Show All to view briefs globally, or filter to specific regions.
Managing briefs
- Archive: Click the archive button on any brief to move it out of your active feed. View archived briefs using the Archived filter.
- Expand: Click any brief to read the full intelligence report.
- Pagination: Navigate through briefs using the Previous/Next controls.
Additional features
Watchlist
Access your Watchlist from the top navigation bar to quickly view and manage your watched shipments across all sections of BoxTrack.
Settings
Access account and application settings via the gear icon in the top-right navigation.
Back to classic view
A "Back to classic" button is available at the bottom of every page to return to the BoxTrack 1.0 interface during the transition period.
Feedback
BoxTrack 2.0 includes a Feedback button on every page. Use it to share suggestions, report issues, or tell the team what features you need most. Many dashboard widgets include a dedicated "Send feedback" and "Tell us what you need" option to help prioritize the roadmap.
Additional resources and support
BoxTrack is designed to provide comprehensive ocean shipment visibility across global supply chains. Below are additional resources to enhance your tracking experience:
- Standardized Shipment Milestones: View here
- Supported Carriers: View here
- Supported Ports + Terminals: View here
To learn more about BoxTrack or if you need additional resources, please reach out to our team at [email protected].
Updated about 16 hours ago